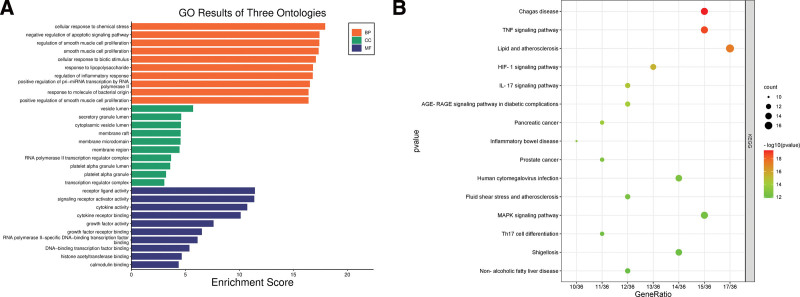
Figure 4.
GO and KEGG enrichment analysis plots. (A) The bar diagram of GO enrichment analysis of YP-SS genes, including the top 10 significant enrichment terms of biological process (BP), cellular component (CC), and molecular function (MF). (B) The bubble plot diagram of KEGG enrichment pathways (top 10). In these plots, the size of a dot corresponds to the number of genes annotated within the respective entry. A larger dot represents a higher number of genes. Additionally, the dot’s color, with a redder shade, indicates a lower q value, signifying a more significant pathway enrichment. GO = gene ontology, KEGG = Kyoto encyclopedia of genes and genomes, YP-SS = Yiqiyangyinquyu prescription-Sjögren’s syndrome.

