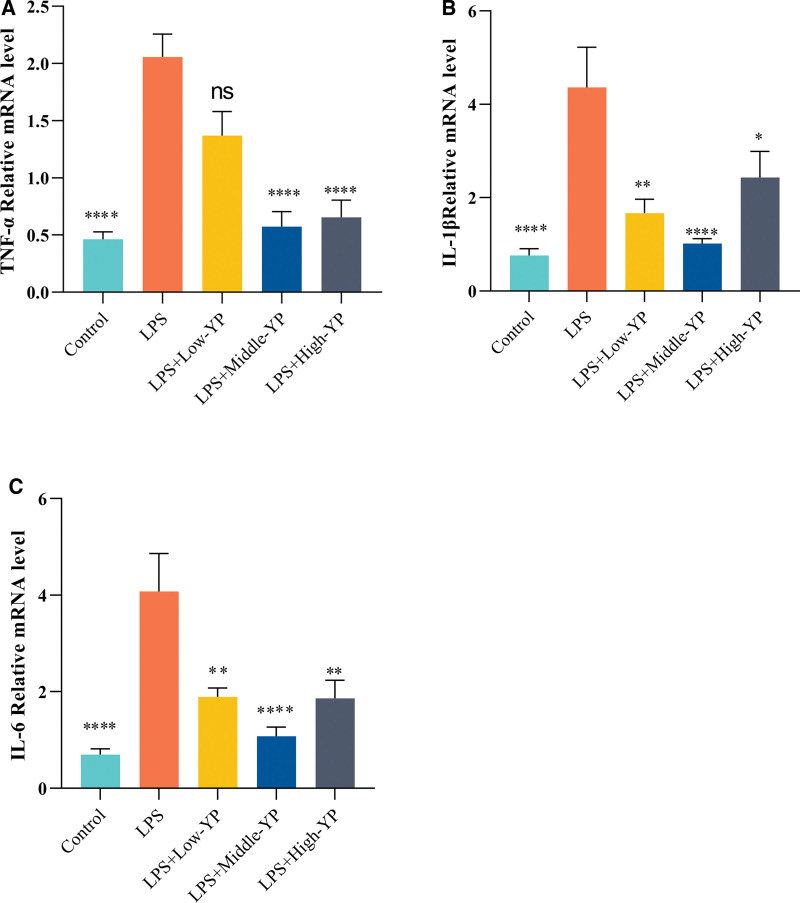
Figure 7.
TNF-α, IL-1β, and IL-6 expression levels in different subgroups of YP concentration. (A) Following YP treatment, the level of TNF-α was lower than that in the model group. This effect was most significant at medium doses (B). Following YP treatment, the level of IL-1β was lower than that in the model group. This effect was most prominent at medium doses (C). After YP treatment, the level of IL-6 was lower than that in the model group, and this effect was most notable at medium doses. P < .0001; ****, P < .0001; ***, P < .0005; **, P < .005; *, P < .05. IL-1β = interleukin 1 beta, IL-6 = interleukin 6, TNF-α = tumor necrosis factor, YP = Yiqiyangyinquyu prescription.

