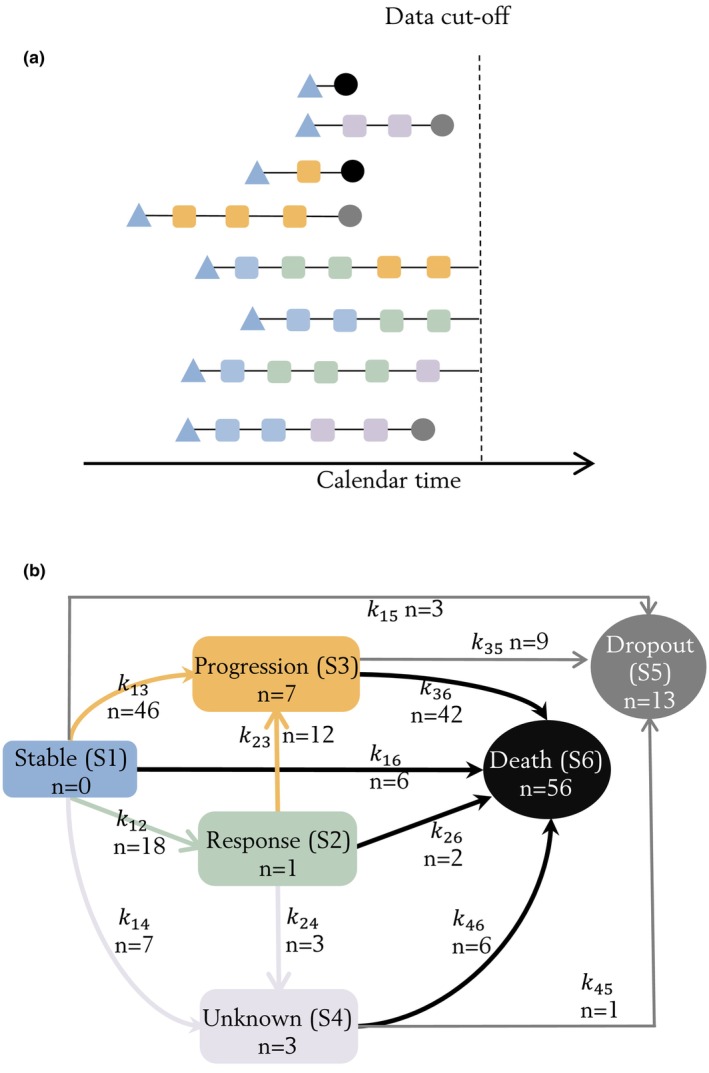
FIGURE 1.

Multistate observations demonstrated with example patients (a). The blue triangles represent the initial state of stable disease (SD) at treatment initiation. The triangle shape indicated that the state of patient was assumed to be SD at first dose administration, as tumor assessment was conducted at screening before the initiation of treatment. The squares represent states observed from repeated overall tumor response evaluations (once every 6 weeks): blue state observations were stable disease (SD); green response state observations were partial response (PR) or complete response (CR); yellow progression state observations were progressive disease (PD); pink unknown state observations (pink) were imputed if the tumor evaluation was terminated without preceding PD documented. The circles represent absorbing states observed as survival events: gray dropout states were observed at the date of last date known to be alive; black death states were observed at the date of death. State and transition diagram (b). Each compartment is a state and the arrows are observed transitions between states. All patients were assumed to have SD (S 1) at treatment initiation (time = 0), and could stay stable (S 1), respond (S 2) or progress (S 3). Patients with response (S 2) could stay in response (S 2) or progress (S 3). State of patients who discontinued treatment without progression (S 1/S 2) would transit to unknown (S 4). If survived pass the data cutoff date, patients could be censored at the intermediate states (S 1/S 2/S 3/S 4). Patients would transit to the absorbing states if dropped out from survival follow‐up (S 5) or died (S 6). Patients who are still alive at the data cutoff date were right censored at their current state. The number of patients who experienced a certain transition between each state, or censored at the intermediate states is represented by n for each arrow or in each box, respectively.
