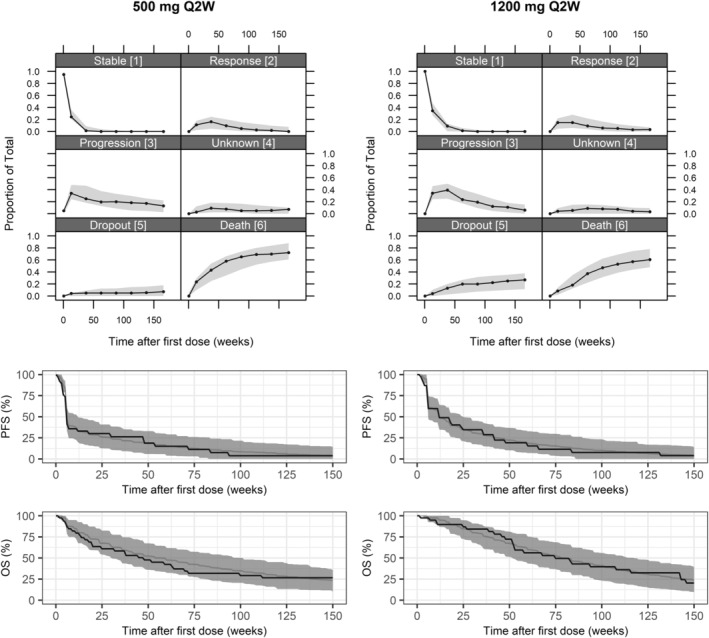
FIGURE 2.

Visual predictive checks (VPCs) of the proportion of patients in each state and Kaplan–Meier curve of progression‐free survival (PFS) and overall survival (OS), stratified on patient receiving 500 or 1200 mg every 2 weeks (q2w) of bintrafusp alfa. In the VPCs of proportion of remaining patients in the different states, solid lines represent the observed data, and gray shaded areas are 95% confidence intervals (CIs) from 500 simulations. In the Kaplan–Meier VPC, the black solid line represents the observed data, the gray solid line represents the median and the gray shaded area is 95% CIs from 500 simulations.
