
FIGURE 2.
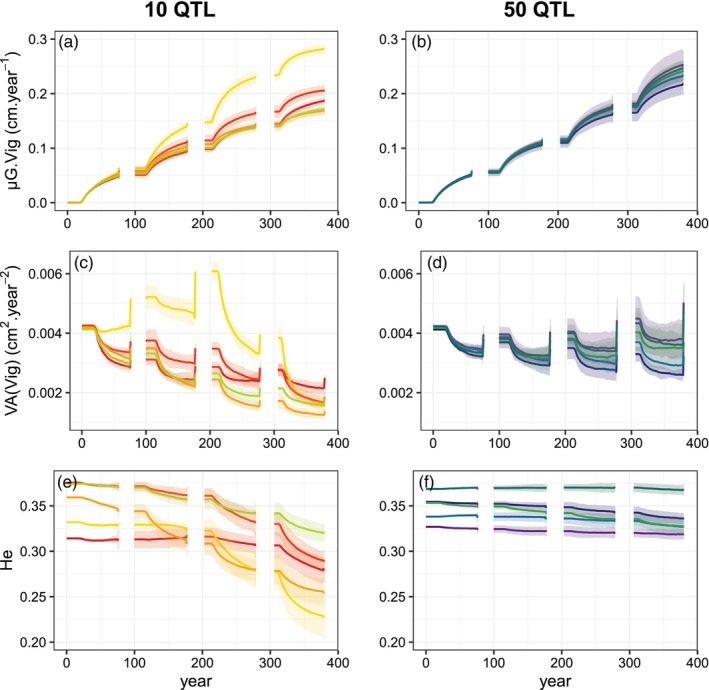
Dynamics of population genetic parameters in the unthinned long cycle scenario (U‐long) without disturbance for 10 QTL and 50 QTL (in columns): population genetic mean, μG.Vig (a, b); genetic variance, VA(Vig) (c, d) and QTL gene diversity, He (e, f). The different colors indicate five genetic setups, i.e., combinations of allelic effects and allelic frequencies representing the same target additive genetic variance, for each number of QTL. The shaded areas represent the 95% intervals over 10 replicates for each genetic setup. Trees are 25 years old when simulations start at Year 0. The pre‐recruitment period is deliberately not represented because the phenotype is not considered in the model during this phase.