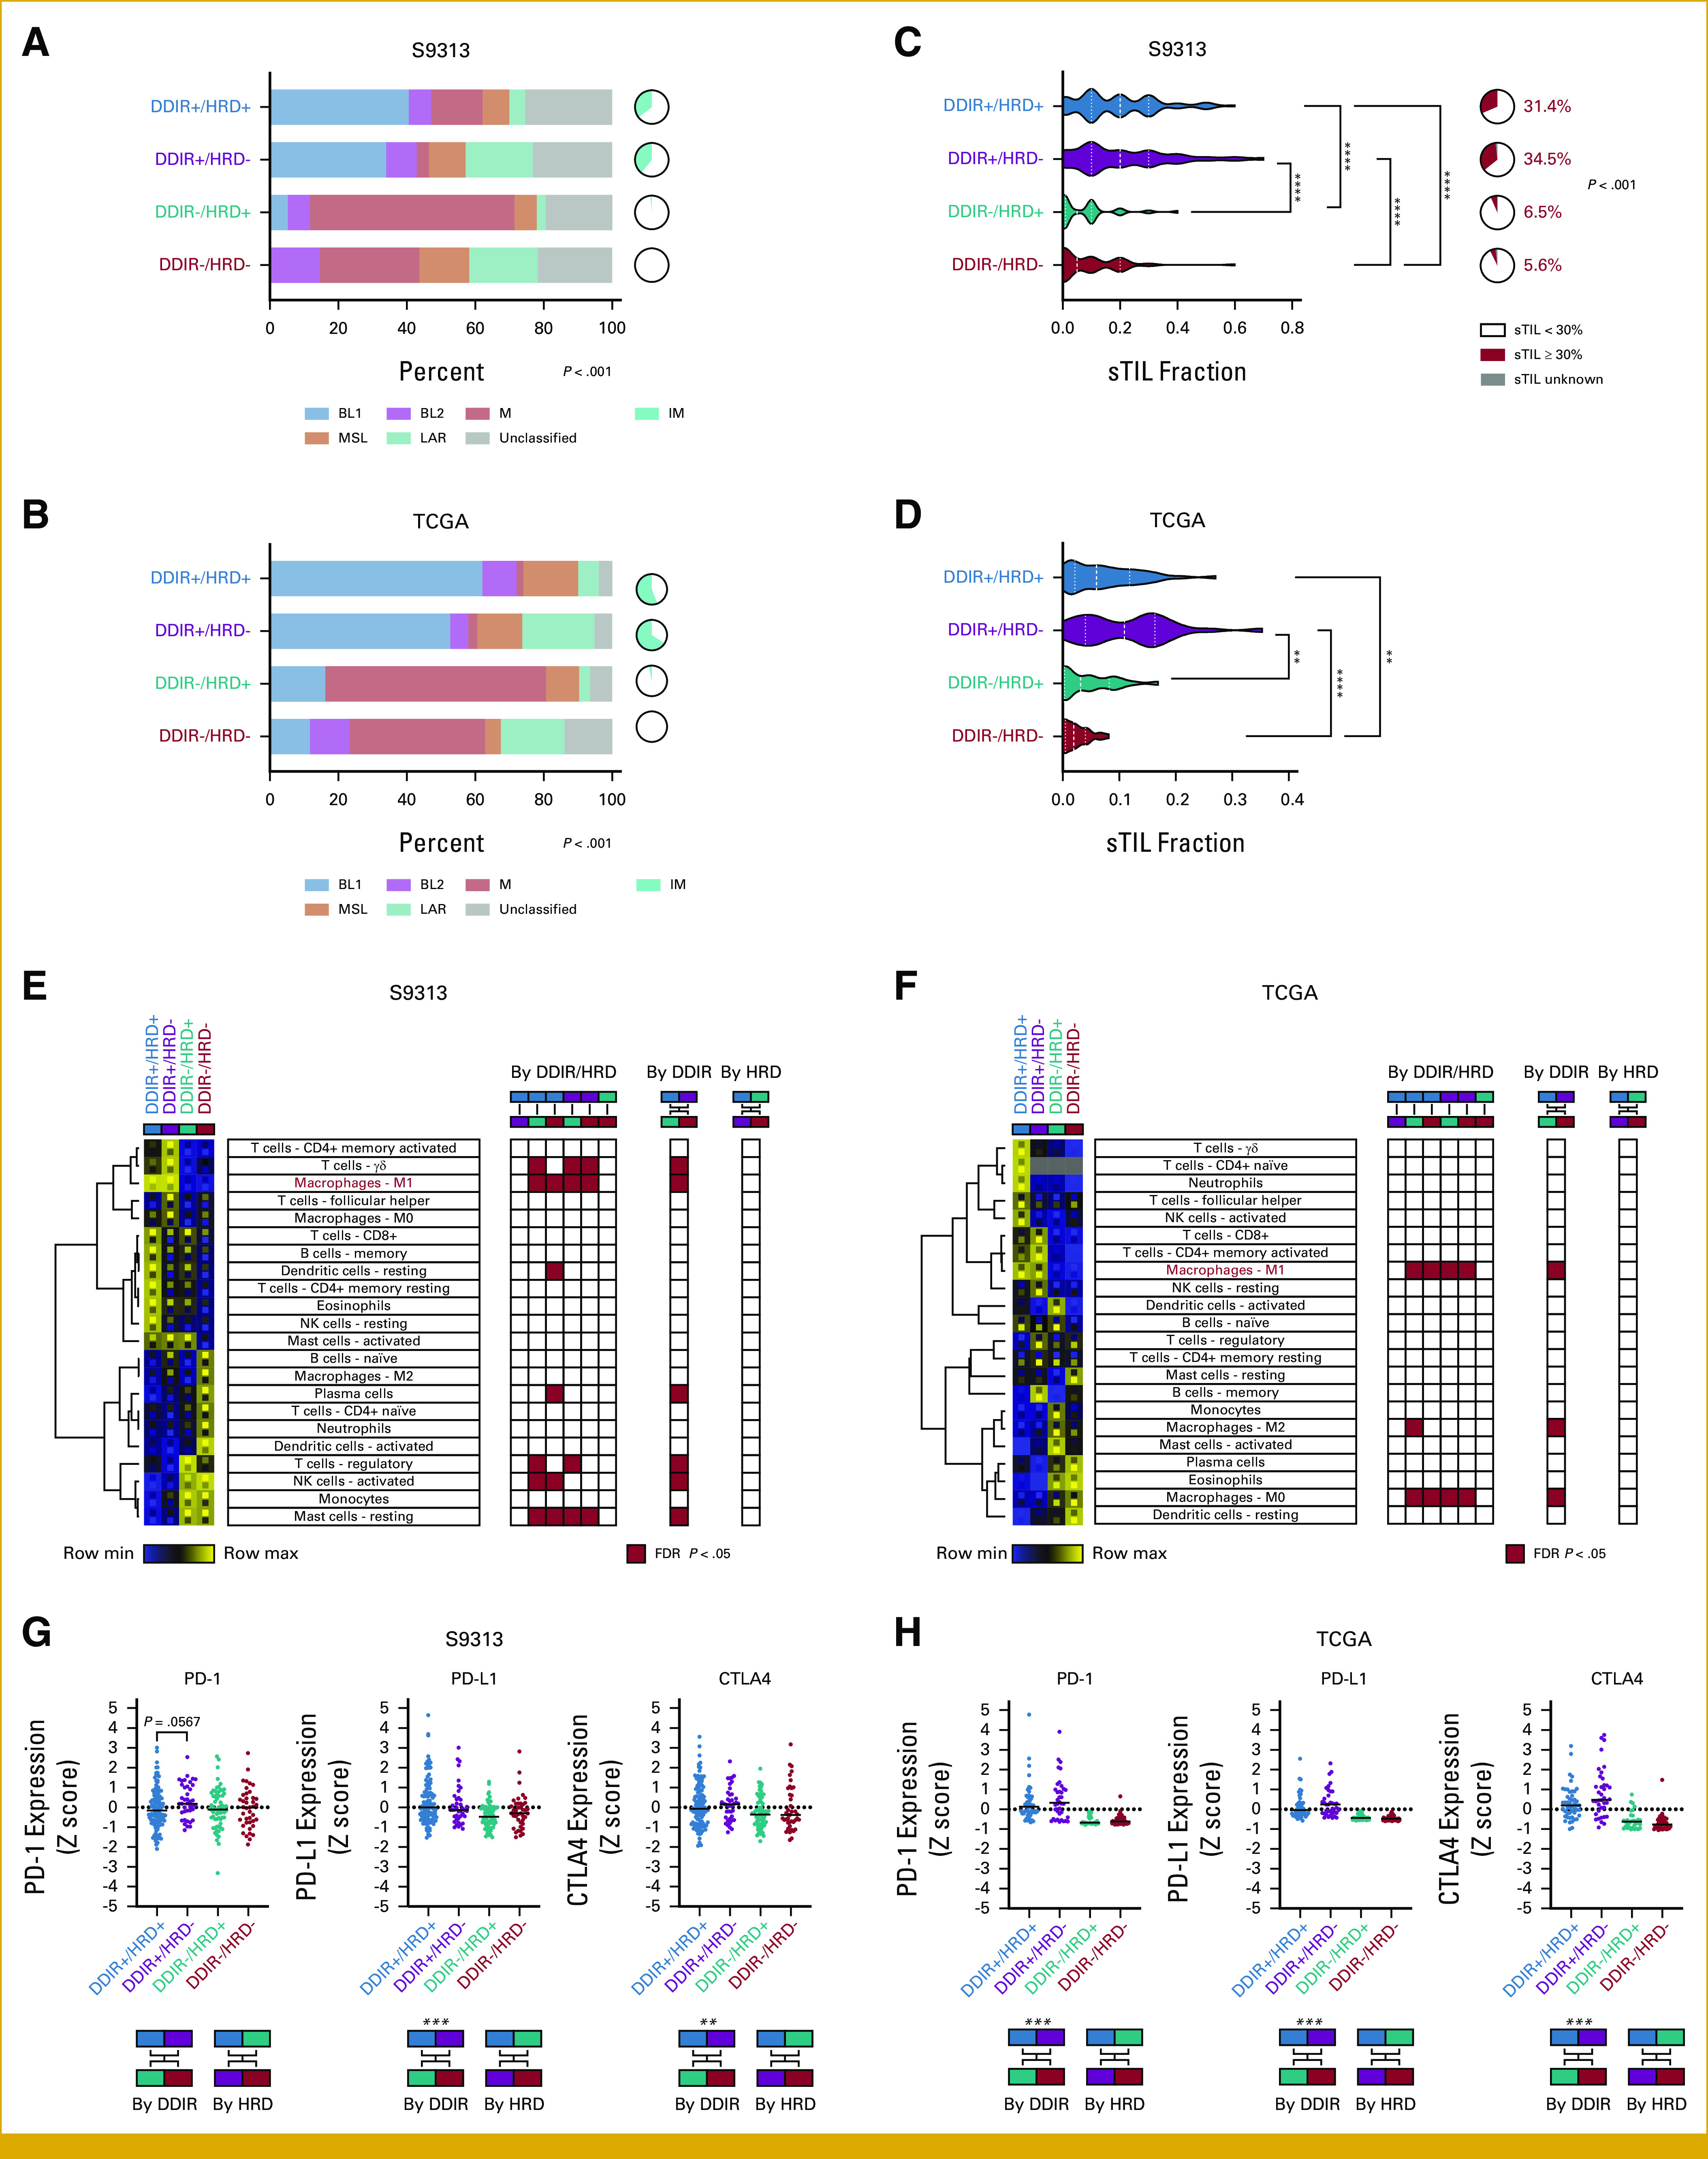
FIG 3.

(A and B) TNBC molecular subtype and immunomodulatory status in the (A) S9313 and (B) TCGA TNBC cohorts. (C) Distribution of sTIL frequency and fraction of tumors with ≥30 sTILs within the S9313 TNBC cohort. For continuous comparison, P is Kruskal-Wallis test with Dunn's multiple comparison correction. For comparison by ≥30% threshold, P is Fisher-Freeman-Halton test. (D) sTIL frequency in the TCGA TNBC cohort. P is Kruskal-Wallis test with Dunn's multiple comparison correction. *<0.05, **<0.01, ***<0.001, ****<0.0001. (E and F) Relative CIBERSORTx leukocyte fractions within the (E) S9313 and (F) TCGA TNBC cohorts. Heatmap reflects mean leukocyte fraction within DDIR/HRD class with upper and lower inset boxes reflecting mean + SE and mean - SE, respectively. Red boxes in grids denote significant differences for each comparison (FDR <0.05). (G and H) Expression of PD-1, PD-L1, and CTLA4 by DDIR/HRD class in the (G) S9313 and (H) TCGA TNBC cohorts. P is Kruskal-Wallis test with Dunn's multiple comparison correction. Binary comparisons by DDIR or HRD status alone are Mann-Whitney, with *<0.05, **<0.01, ***<0.001, ****<0.0001. DDIR, DNA damage immune response; FDR, false discovery rate; HRD, homologous recombination deficiency; sTIL, stromal tumor infiltrating lymphocyte; TCGA, The Cancer Genome Atlas; TNBC, triple-negative breast cancer.
