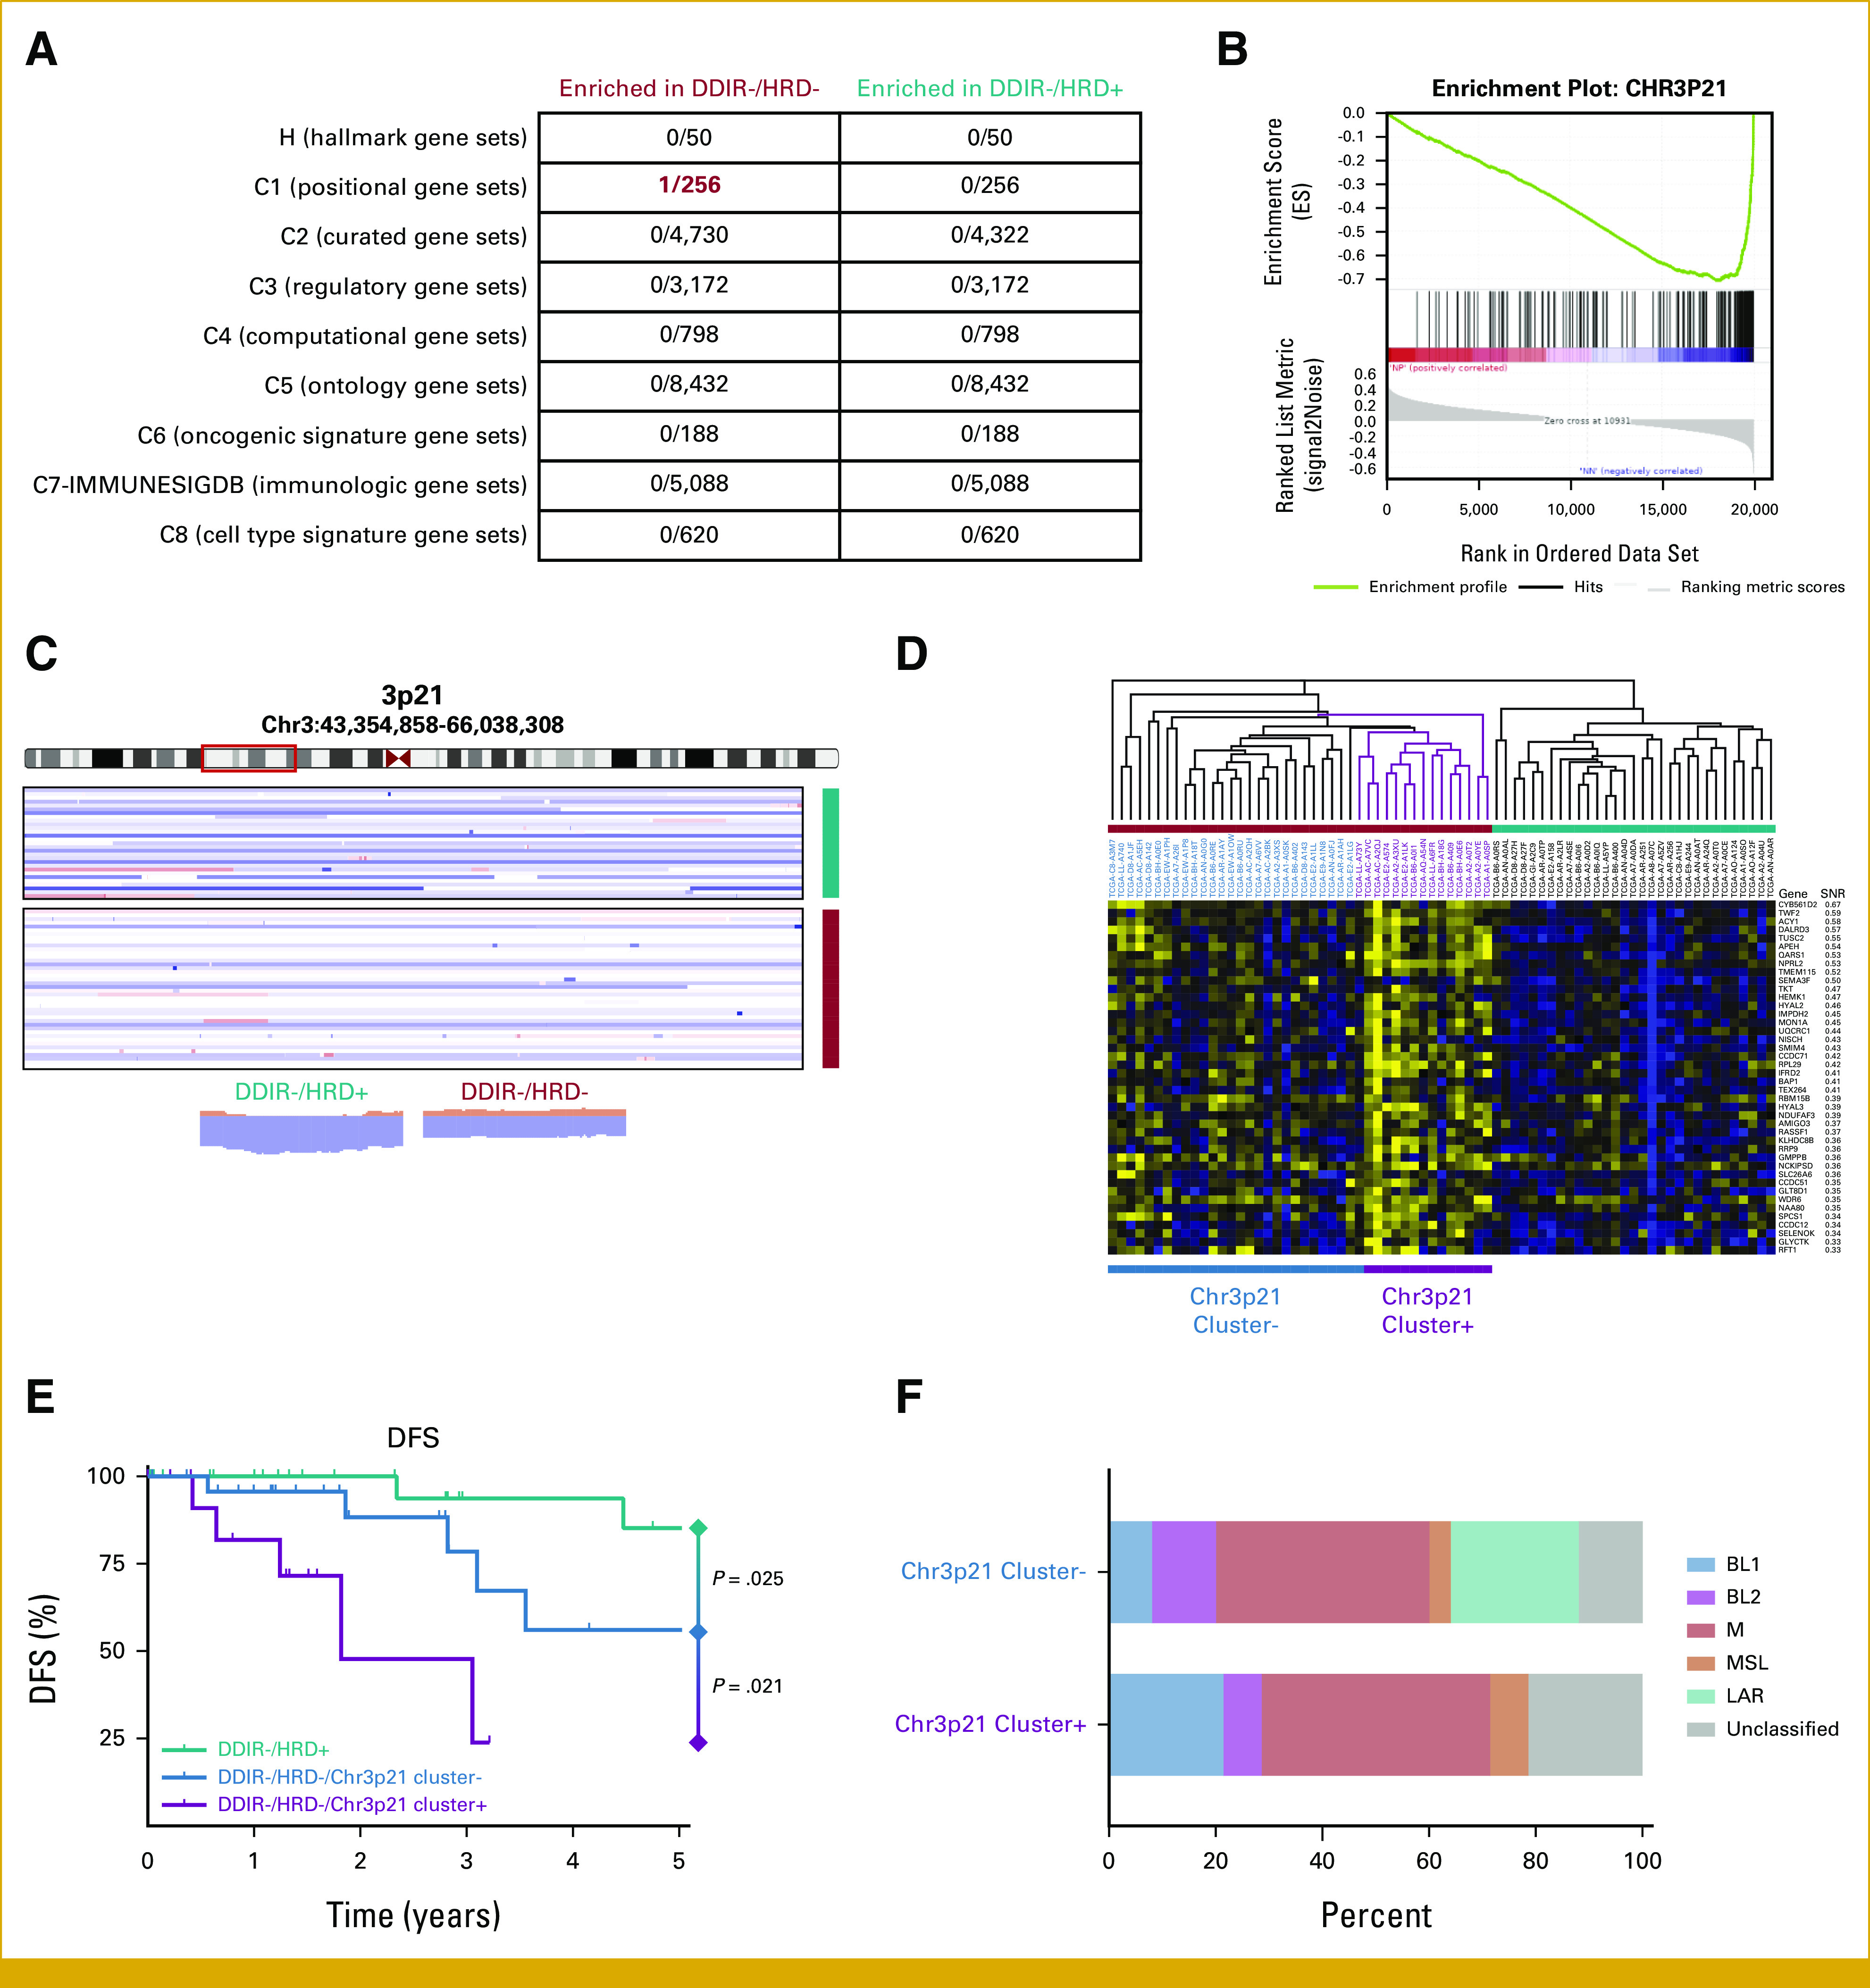
FIG 4.

(A) Gene set enrichment analysis. Numerator in each box denotes significant (FDR <0.05) gene sets within the entire set of genes analyzed (denominator). (B) Enrichment plot for Chr3p21 positional gene set between DDIR–/HRD– and DDIR–/HRD+ tumors. (C) Copy number plot for Chr3p21 locus. Plots at bottom show summary copy-number changes among DDIR–/HRD– and DDIR–/HRD+ classes. (D) Expression profile of Chr3p21 genes within DDIR–/HRD– and DDIR–/HRD+ tumors, with identification of Chr3p21 cluster+ tumors within DDIR–/HRD– class. (E) DFS among DDIR–/HRD– tumors with and without the Chr3p21 expression cluster signature and DDIR–/HRD+ tumors. P is log-rank. (F) TNBC molecular subtype by Chr3p21 cluster expression within DDIR–/HRD– tumors. DDIR, DNA damage immune response; DFS, disease-free survival; FDR, false discovery rate; HRD, homologous recombination deficiency; TNBC, triple-negative breast cancer.
