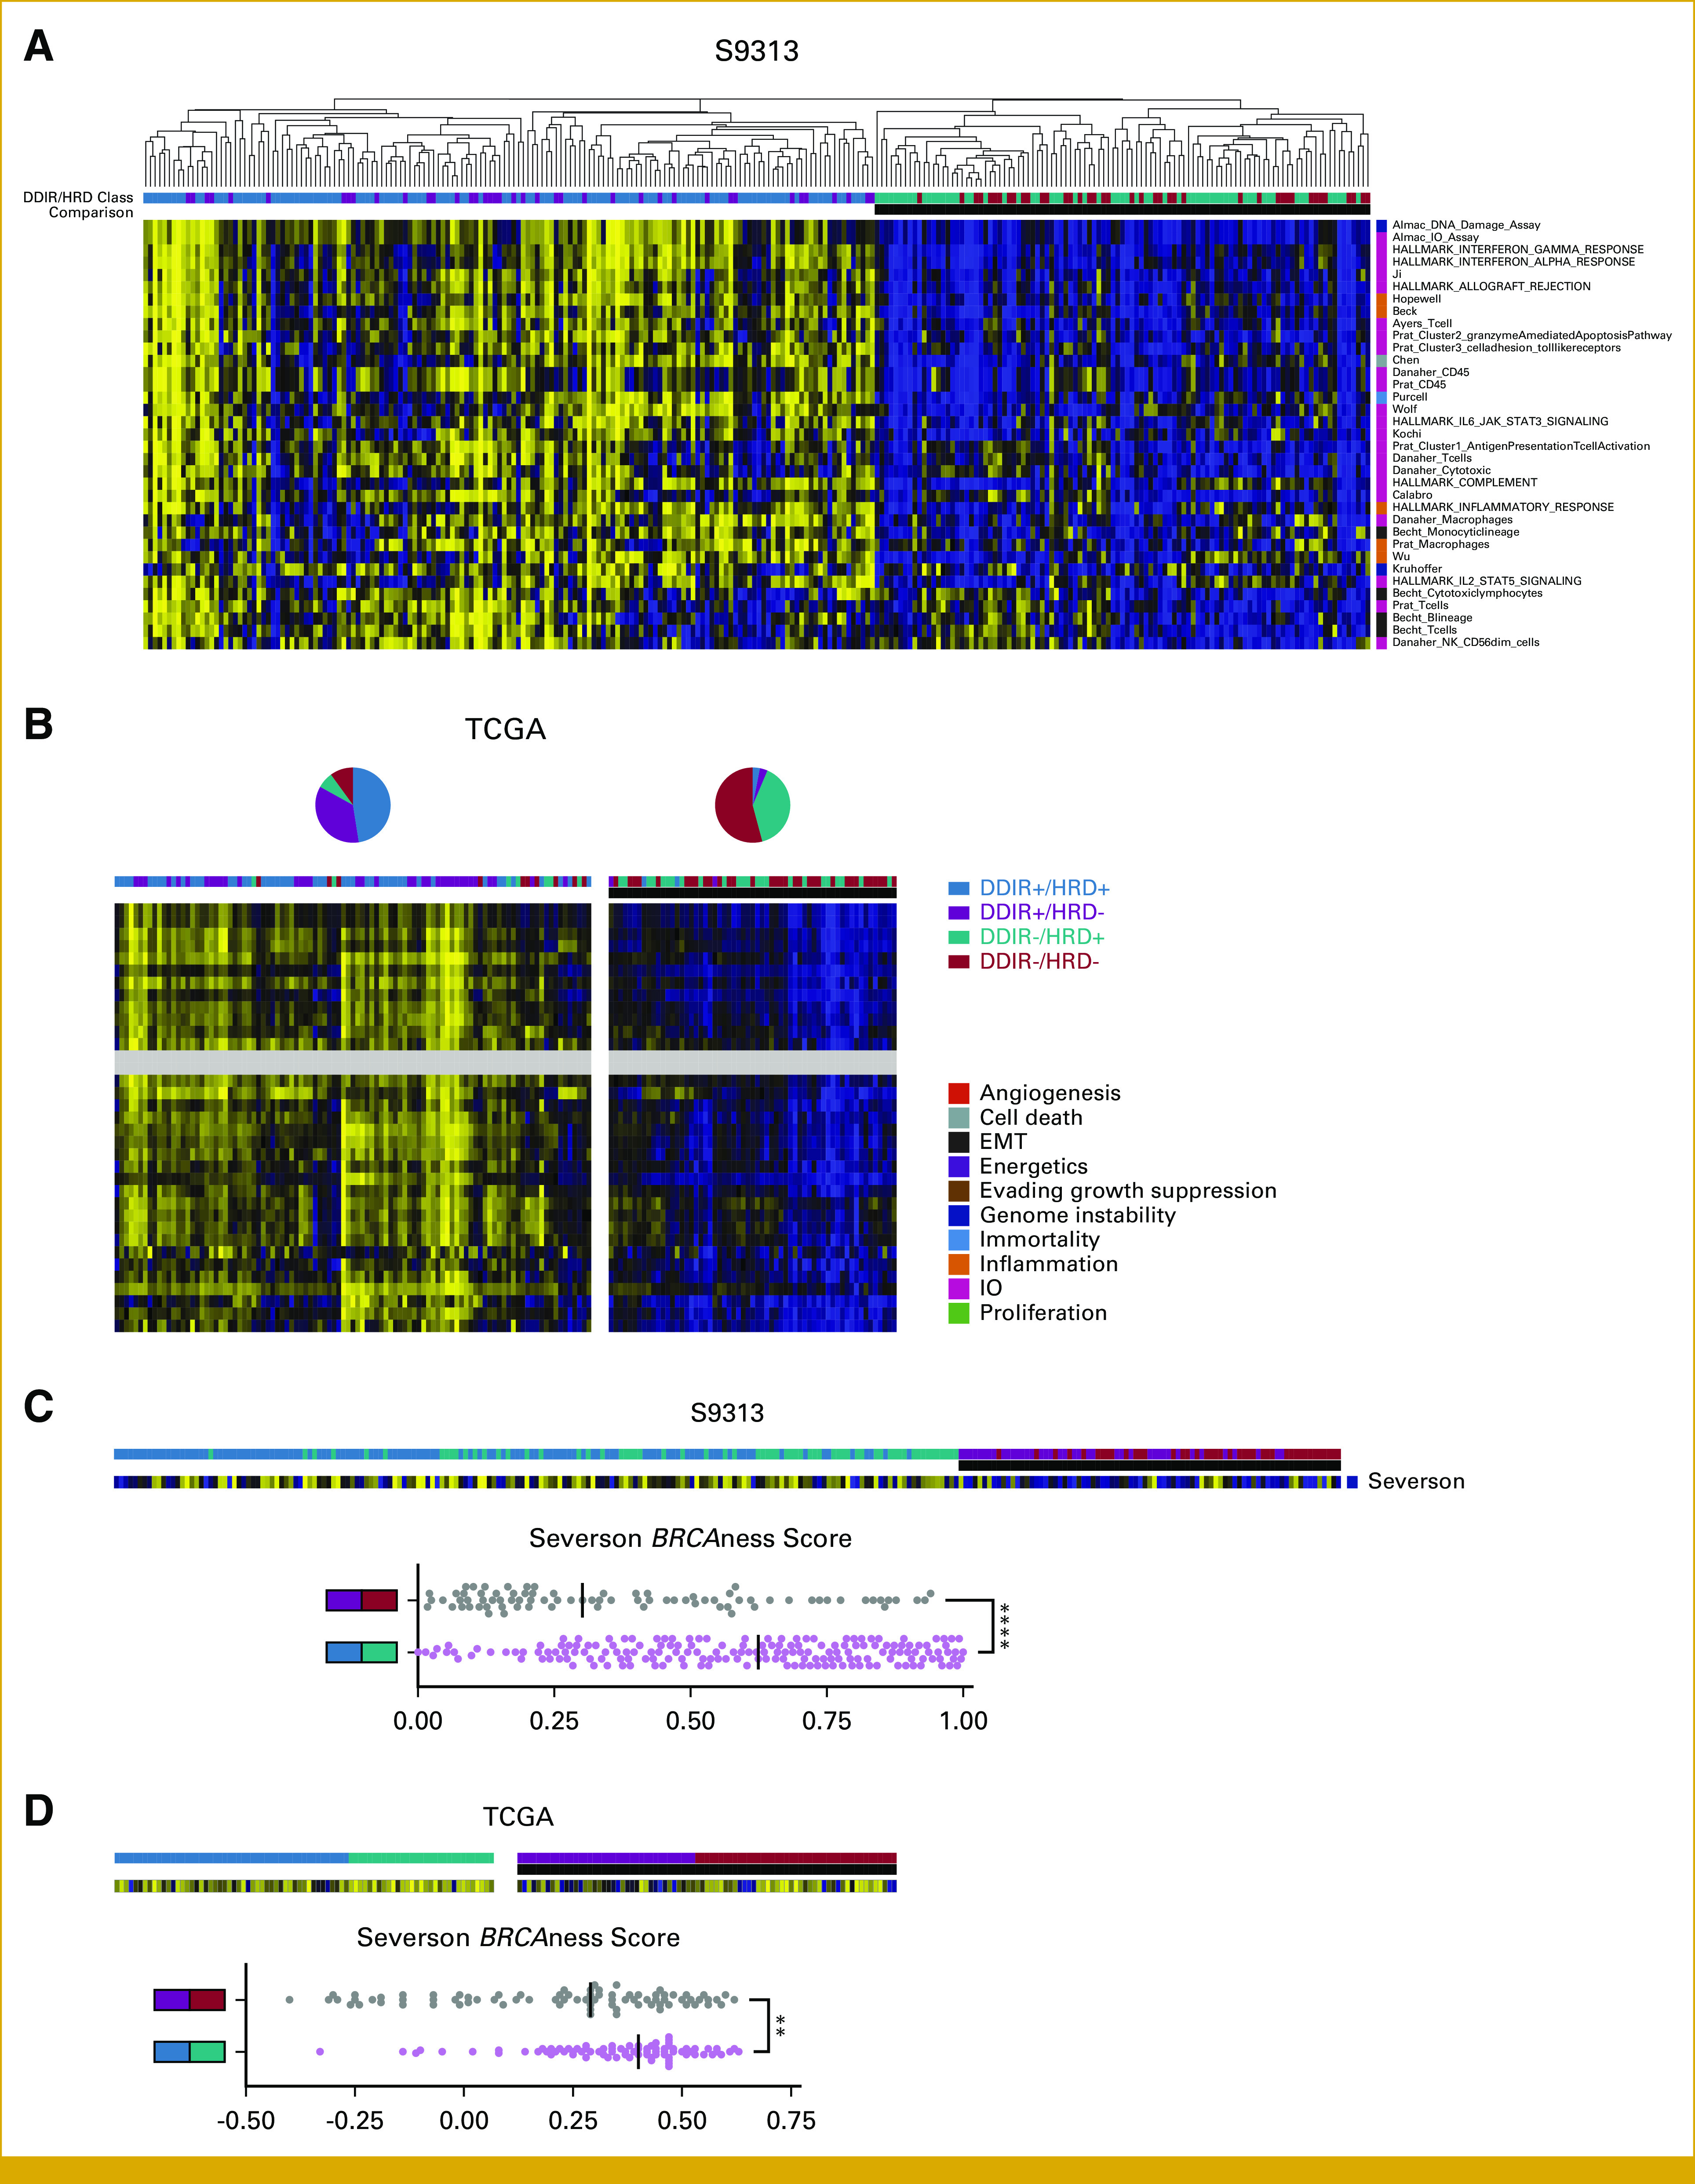
FIG A3.

(A) Gene expression signatures that differ between DDIR+ and DDIR– tumors within the S9313 cohort. (B) Analysis of discriminating gene expression signatures by DDIR status in the S9313 cohort by k-means clustering (k = 2) within the TCGA cohort. Pie charts denote distribution of DDIR/HRD classes within the two clusters. (C) Gene expression signature that differs between HRD+ and HRD– tumors within the S9313 cohort, and (D) analysis of discriminating gene expression signature by HRD status in the S9313 within the TCGA cohort. DDIR, DNA damage immune response; EMT, epithelial-mesenchymal transition; HRD, homologous recombination deficiency; IO, immuno-oncology; TCGA, The Cancer Genome Atlas.
