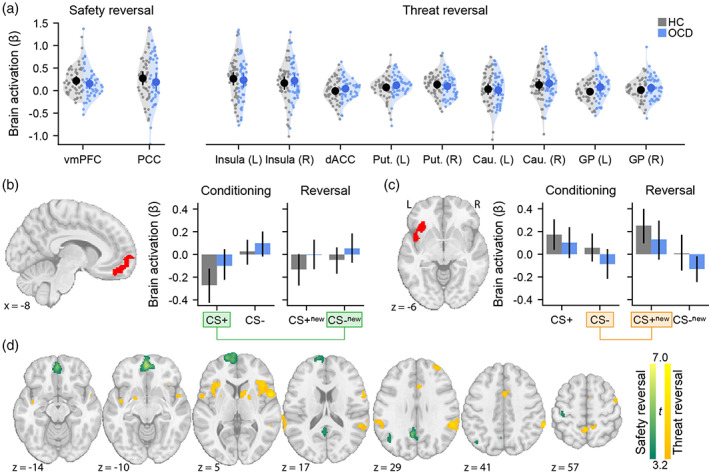
FIGURE 2.

Brain activity during fear and safety reversal. Regions of interest were derived from an independent dataset (Figure S3). (a) Safety (left) and threat (right) reversal activation patterns across all ROI (Figure S2). Raw data, as well as means and confidence intervals (95%) are displayed. There are no significant differences between healthy control (HC, grey data) and OCD (blue data) groups. (b) VmPFC brain activation across the conditioning and reversal phases. (c) Left insula brain activation across the conditioning and reversal phases. Safety reversal (CS−new − CS+) and threat reversal (CS+new − CS−) contrasts are highlighted in green and orange, respectively. (d) Exploratory whole brain mapping results for safety (green) and threat reversal contrasts (orange) (cluster‐forming height threshold: p < .001, cluster threshold: p FDR < .01). No significant group differences were observed, even after relaxing the cluster threshold (p FDR < .05). Cau, caudate; dACC, dorsal anterior cingulate cortex; PCC, posterior cingulate cortex; Put, putamen; vmPFC; ventromedial prefrontal cortex.
