FIGURE 3.

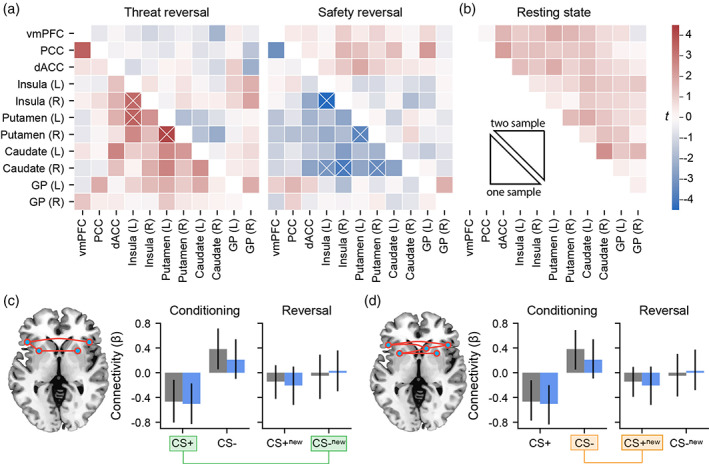
Task and resting state connectivity. (a) Change in FC associated with threat and safety reversal. The lower triangle represents the average one‐sample (across groups) response, whereas the upper triangle represents the comparison between OCD and HC. Crosses represent significant network components (p FWE < .05). (b) Differences in resting state FC. No group differences were observed. (c) The significant safety reversal FC network component identified with the network‐based statistic. Average FC values are plotted across the conditioning and reversal phases. (d) The significant threat reversal FC network across the conditioning and reversal phases. Safety reversal (CS−new − CS+) and threat reversal (CS+new − CS−) contrasts are highlighted in green and orange, respectively. dACC, dorsal anterior cingulate cortex; GP, globus pallidus; PCC, posterior cingulate cortex; vmPFC, ventromedial prefrontal cortex.
