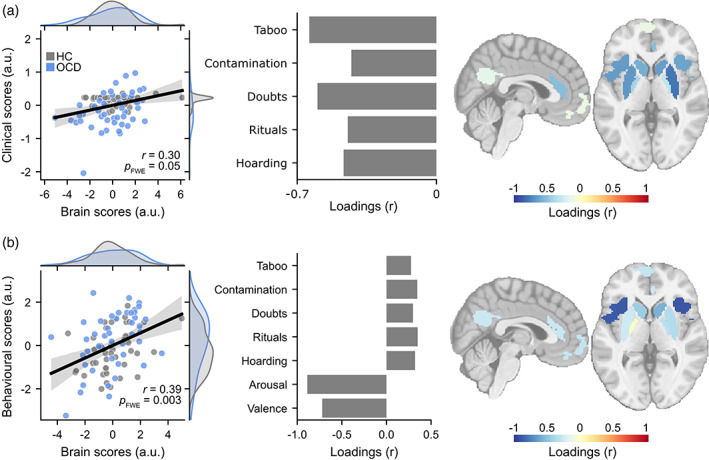
FIGURE 4.

Multivariate brain‐symptom relationship using partial least squares (PLS). (a) Initial symptom factor model. The left‐most panel demonstrates the relationship between individual brain activation PLSC scores and behavioural PLSC scores. Grey data represent healthy control scores, blue represent OCD scores. The middle panel shows the correlation between the original behavioural variables and the behavioural PLSC scores. The right‐most panel shows the correlation between brain activation and the brain PLSC scores. The analysis highlights the association between the observed OCD symptom patterns and brain activation patterns, showing that taboo and doubt symptom factors were linked to decreased threat reversal (but not safety reversal) brain activation (and vice versa). (b) Secondary model with arousal and valence subjective ratings included, showing that higher subjective scores were linked to increased bilateral insula activation (and vice versa).
