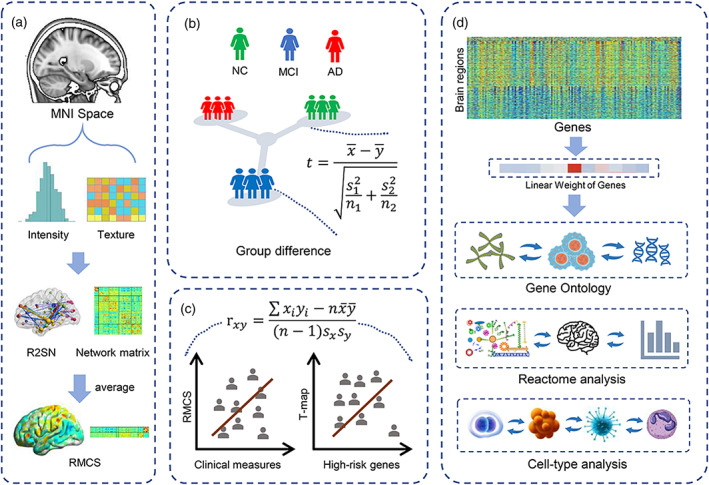
FIGURE 1.

Schematic of the data analysis pipeline. (a) The construction of R2SN. (b) Group difference analysis of the RMCS among the NC, MCI, and AD groups. (c) Correlation analysis between RMCS and clinical measures/AD high‐risk genes. (d) Gene ontology, Reactome, and cell‐type analysis.
