FIGURE 5.

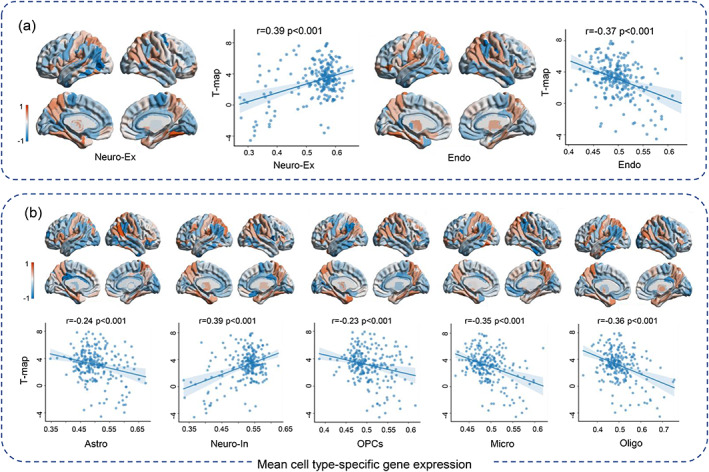
The results of associations between standardized cell type‐specific gene expression maps and T‐map of the RMCS in AD versus NC, including (a) Neuro‐Ex and Endo (b) Astro, Neuro‐In, OPCs, Micro and Oligo.

The results of associations between standardized cell type‐specific gene expression maps and T‐map of the RMCS in AD versus NC, including (a) Neuro‐Ex and Endo (b) Astro, Neuro‐In, OPCs, Micro and Oligo.