
FIGURE 2.
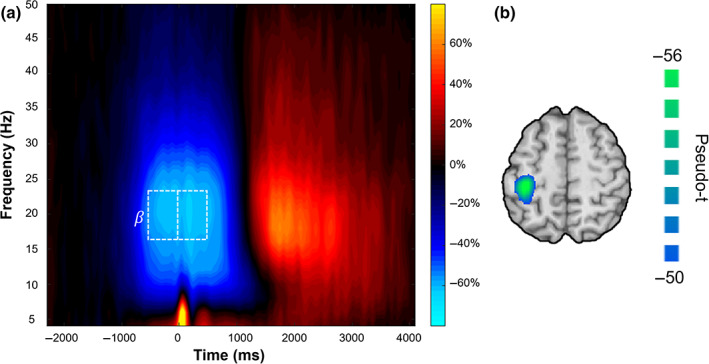
Time‐frequency spectrogram and source reconstruction. (a) Grand‐averaged time‐frequency spectrogram across all participants from a sensor near the left sensorimotor cortex (i.e., MEG0432). Time (ms) is displayed on the x‐axis with frequency (Hz) on the y‐axis. Signal power is expressed as a percent change from baseline. Before and during movement, there was a strong beta event‐related desynchronization (ERD; 16–24 Hz), followed by a post‐movement beta rebound (PMBR). The white box displays the two time‐frequency bins selected for beamforming analyses (planning: −500 to 0 ms; execution: 0–500 ms; both at 16–24 Hz) to isolate the motor planning and execution phases. Note that we did not image the PMBR because it is tightly linked to motor termination, and our study was focused on motor planning and execution processes. (b) Grand‐averaged beamformer image across both time windows and groups showed that the beta ERD was strongest in the contralateral primary motor cortices. The peak voxel was located at the same coordinates in the grand‐averaged image computed using the planning and execution images separately, as well as combined. Voxel time series data were extracted using the peak voxel in this grand‐averaged map.