
FIGURE 4.
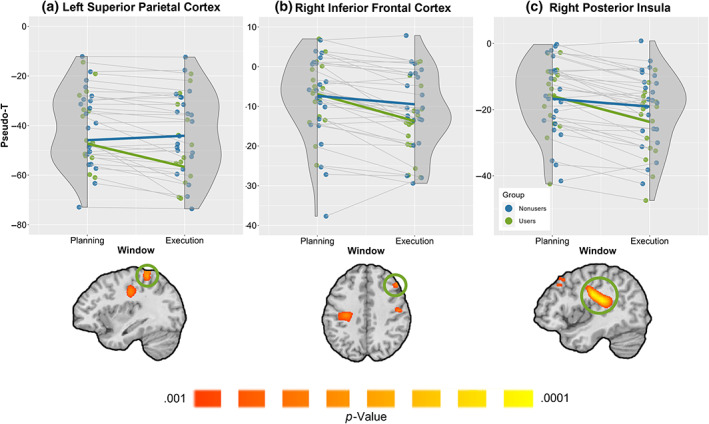
Group‐by‐window interaction effect. Cannabis users exhibited stronger β‐ERD responses during the execution phase compared to nonusers in the (a) left superior parietal cortices, (b) right inferior frontal cortices, (c) right posterior insula, and the left primary motor cortices (p < .001, corrected). The groups did not differ during the motor planning phase. (Top) Rain cloud plots showing peak voxel pseudo‐t values per participant from the region with the green circle in the images below each plot. Users are shown in green and nonusers in blue. The x‐axis is separated into the planning and execution windows (i.e., −500 to 0 and 0 to 500, respectively), and the y‐axis displays pseudo‐t values. (Bottom) Statistical maps showing the group‐by‐window interaction effect. In addition to the three regions noted above, significant clusters were found in the right (ipsilateral) precentral gyrus and the left (contralateral) precentral gyrus.