
FIGURE 1.
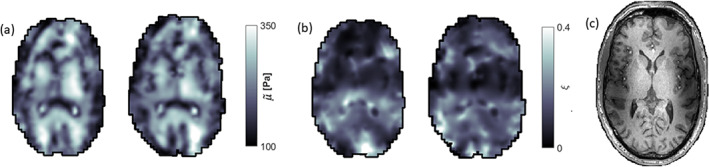
Representative axial slices of the (a) shear stiffness, , and the (b) damping ratio, , for one subject along with repeat scans that have been co‐registered to the initial scan. A T1‐weighted image of the equivalent slice is shown in (c). Consistent spatial patterns can be observed throughout the property maps, and the repeated scans show strong structural similarity to that of the original scans, especially for the shear stiffness. The damping ratio maps show some consistency between repeated scans but only limited similarity to the anatomical scan, likely due to data‐model mismatch and the noise propagation of the two reconstructed parameters, G′ and G″ into this composite parameter (see Section 4). The dark regions observed in the shear stiffness maps largely correspond to CSF‐tissue boundaries. Large‐valued hotspots can be seen in the repeated scan of the shear stiffness map, and in the original scan of the damping ratio map. The shear stiffness has been denoted with a tilde to the relative nature of the recovered solutions (see Section 2).