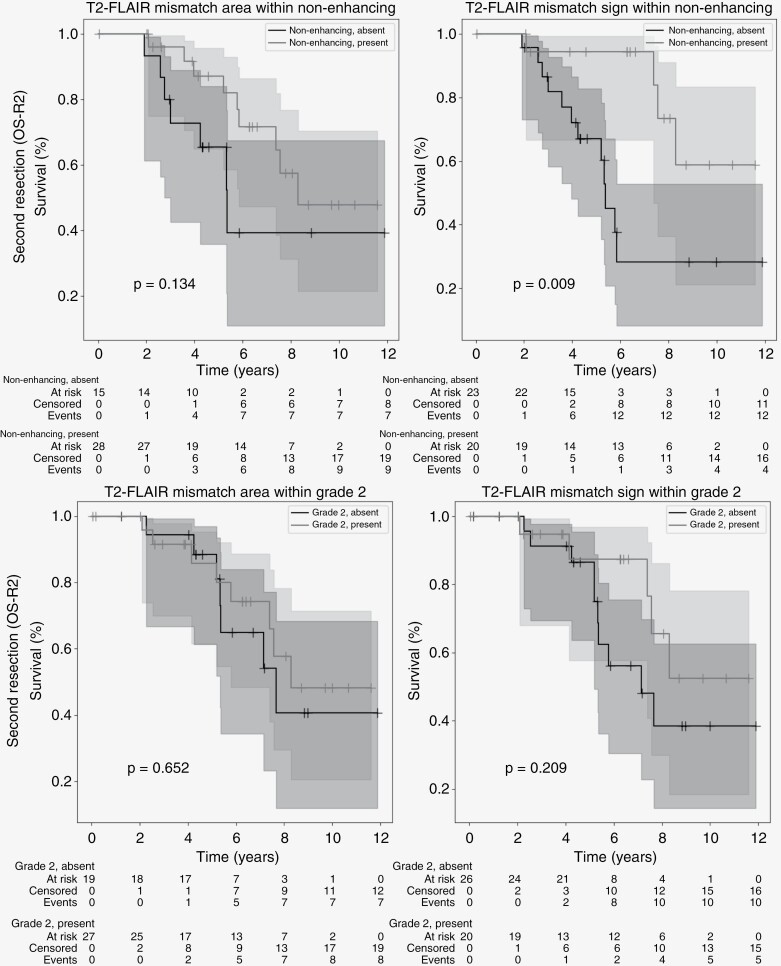
Figure 4.
Kaplan–Meier curves of mismatch area (left) and sign (right) combined with other indicators of good prognosis at second resection. Top: Nonenhancing lesions. Bottom: WHO-2021 Grade 2. Starting date of the analysis is date of second resection. T2-FLAIR mismatch area/sign and enhancement were annotated on the last available MRI before resection. Censored patients indicated by a “+” at date of last follow-up. Shaded areas indicate 95% confidence intervals.

