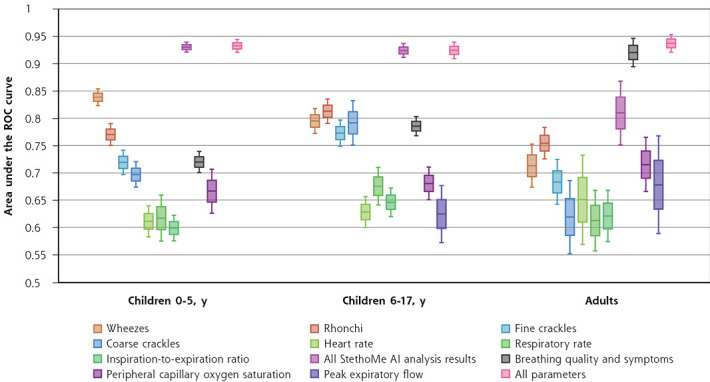
Figure 4.

Results of the effectiveness (in terms of AUC) of different sets of home-collected data in decision support systems classifying asthma exacerbations.
AI = artificial intelligence; AUC = area under the ROC curve; ROC = receiver operating characteristic.
Note: The central line in each box denotes mean AUC, box edges extend to 1 SD from the mean, and fences (whiskers) denote 95% CI.
