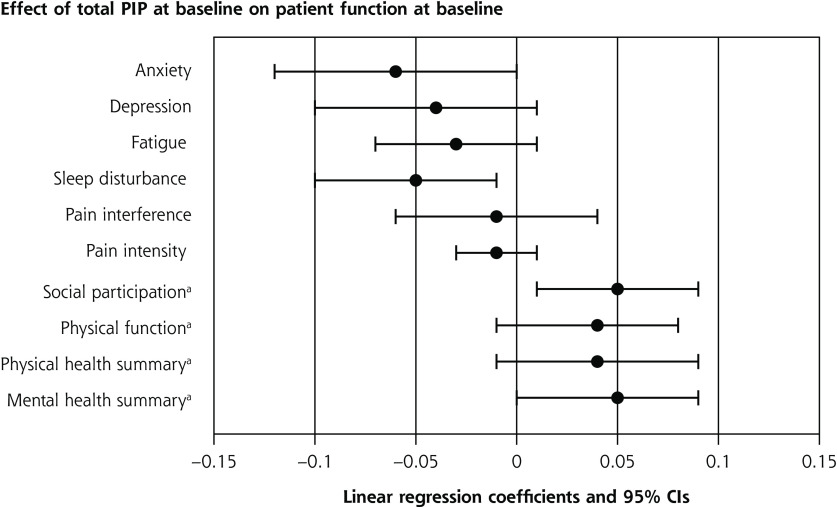
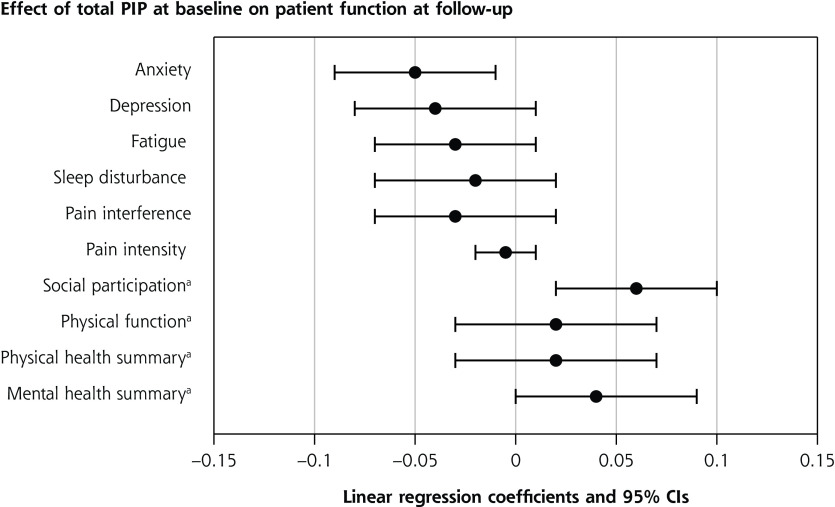
Figure 3.
Association of practice integration and patient outcomes.
PIP = Practice Integration Profile.
Note: The center point of each bar is the mean adjusted association (regression coefficient) of the baseline median total PIP score with specific patient outcomes, adjusting for potential confounders and using a random intercept for each practice. The bars represent 95% CI. Values >0 indicate that the intervention was associated with an increase in the outcome measured. Bars that do not cross 0 indicate statistical significance (P < .05).
a Greater score indicates improved outcome.


