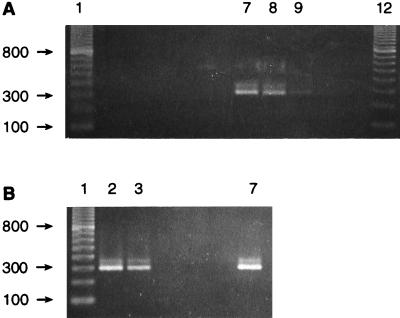
FIG. 3.
PCR amplification with the RTS1-RTS4 primer pair and DNA. (A) Amplification of DNA from tilapia (5 ng) (lane 5), cell line CHSE-214 (25 ng) (lane 6), P. salmonis EM-90 propagated in CHSE-214 (5 ng) (lane 7), tissue from trout R8 with visible signs of piscirickettsiosis (lane 8), serum from trout R8 (lane 9), tissue from trout Rb1 with no signs of disease (probably not infected) (lane 10), and serum from trout Rb1 (lane 11). Lanes 1 and 12 contained a 100-bp ladder, and lanes 2 to 4 contained negative extraction controls. (B) Amplification of DNA from tissue from trout C3 with no signs of piscirickettsiosis (taken from a netpen containing individuals with the disease) (lane 2), serum from trout C3 (lane 3), tissue from coho salmon CM13 with no signs of disease (lane 4), serum from coho salmon CM13 (lane 5), serum from coho salmon CM6 with no signs of disease (lane 6), and serum from coho salmon CE1 with visible piscirickettsiosis (lane 7). Amplification reactions with coho salmon and trout tissues and sera were performed with 25 ng of total genomic DNA. Lane 1 contained a 100-bp ladder. Sizes (in base pairs) are indicated on the left. Lane numbers are given only for lanes in which the reactions produced the expected amplification product.

