Figure 5.
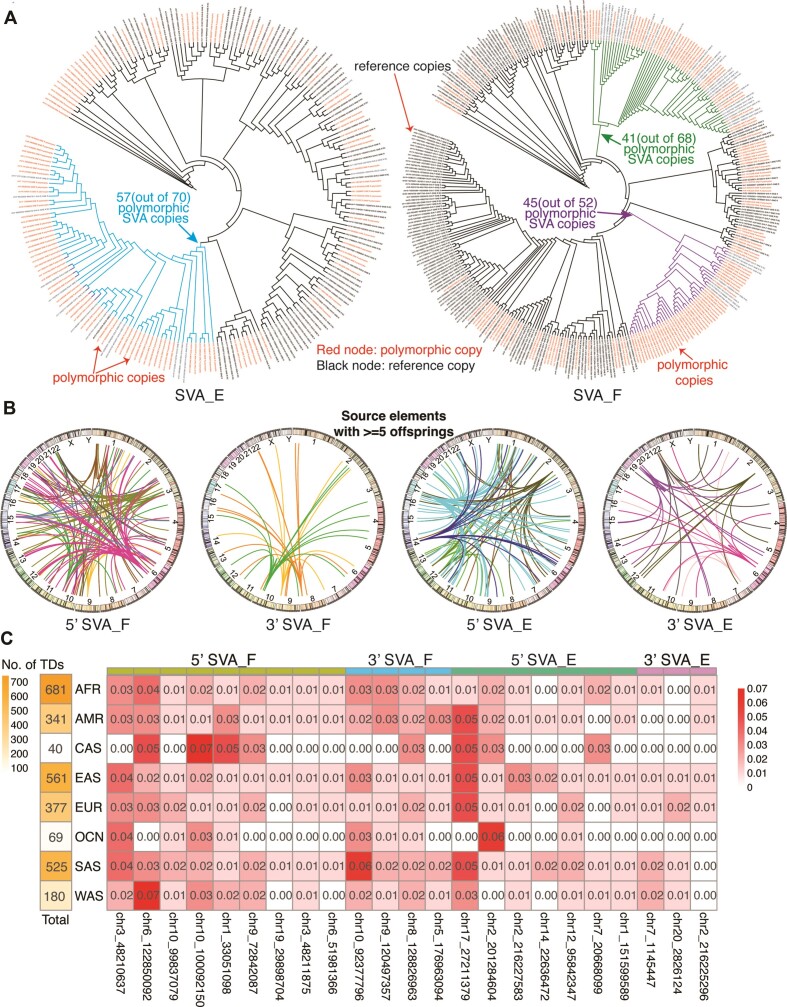
Phylogenetic analysis of SVA retrotransposons and activity by subfamily. For subfamilies SVA_E and SVA_F, we selected the long read-assembled polymorphic SVA insertions with an integrated SINE-R region and merged them with those full-length reference SVA copies. (A) Left: We built the phylogenetic tree for the 118 polymorphic and 100 reference full-length SVA_E copies. The highlighted branch (in blue) is the youngest and a very active branch with 57 (out of 70) polymorphic SVA copies. Right: Similarly, for 156 polymorphic and 192 full-length reference SVA_F copies. Surprisingly, some middle-aged branches are active. For example, the green and purple branches have 41 (out of 68) and 45 (out of 52) polymorphic SVA copies, respectively. (B) We summarized the source copies that have ≥5 offspring insertions from the germline insertion set called from the 3646 samples, divided by subfamily (SVA_E or SVA_F) and transduction type (5′ or 3′). From SVA_F, one ‘hot’ SVA_E source element at chr17 has 65 offspring insertions with a 5′ transduction. (C) The first column shows the total number of SVA transductions per population. The table shows the population AF for selected ‘hot’ SVA_E and SVA_F source elements. Each column is one selected hot SVA source element, and each cell is the ratio of the number of offspring from the specific population to the total number of transductions of the population.

