Figure 1.
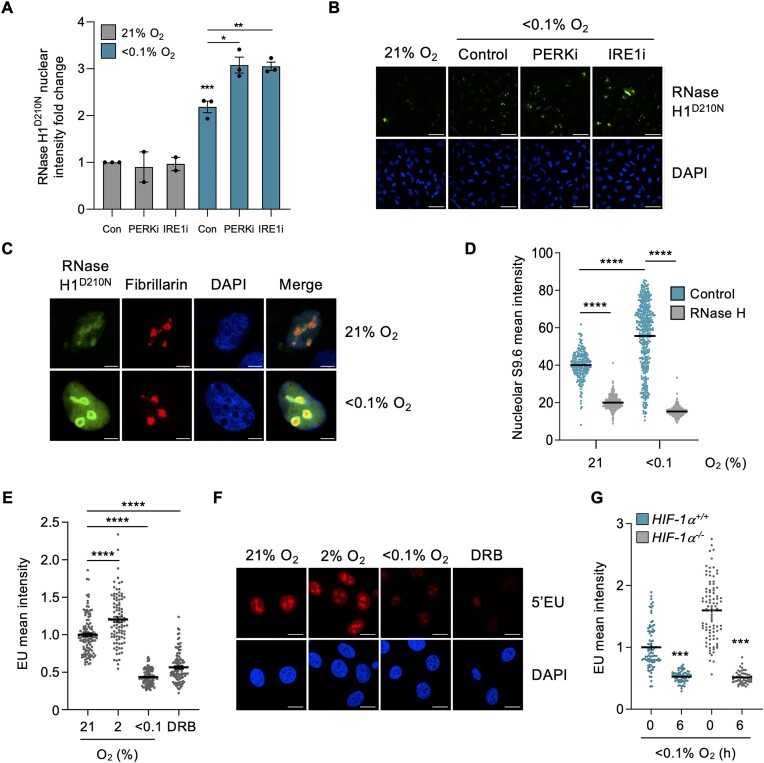
R-loops accumulate in the nucleoli of hypoxic cells despite reduced transcription rates. (A) A549 cells were transfected with V5-tagged RNase H1D210N and exposed to 21 or <0.1% O2 (6 h) with or without a UPR inhibitor: PERK inhibitor (AMG PERK 44, 20 μM) or IRE1α inhibitor (4μ8c, 20 μM). Staining for V5 was carried out and nuclear intensity determined. Each data point represents the average from one of three biological repeats. (B) Representative images from part A. Scale bar represents 50 μM. (C) A549 cells were transfected with V5-tagged RNase H1D210N and exposed to 21 or <0.1% O2 (6 h). Cells were fixed and co-stained for V5 (green), the nucleolar marker fibrillarin (red) and DAPI (blue). Scale bar represents 5 μM. n= 1 Images of a field of view shown in Supplementary Figure S1E. (D) HCT116 cells were exposed to 21 or <0.1% O2 (1.5 h), fixed and co-stained for nucleolin and R-loops using the S9.6 antibody. Where indicated, coverslips were treated with recombinant RNase H. The mean nucleolar intensity of S9.6 staining per cell was determined. Representative images are shown in Supplementary Figure S1F. (E) HCT116 cells were exposed to 21, 2 or <0.1% O2 (6 h) and labeled with 5′EU (0.5 mM). The mean nuclear intensity of 5′EU per cell was quantified. DRB (100 μM, 6 h), a global transcriptional inhibitor, was used as a control. (F) Representative images from part E. Scale bar represents 10 μM. (G) HCT116 and HCT116HIF-1α-/- cells were exposed to 21 or <0.1% O2 (6 h) and labeled with 5′EU (0.5 mM). The mean nuclear intensity of 5′EU per cell was quantified. HIF-1α knockout was confirmed in Supplementary Figure S1I. (A–G) Data from three independent experiments (n= 3), mean ± standard error of the mean (SEM) are displayed unless otherwise indicated. * P < 0.05, ** P < 0.01, *** P < 0.001, **** P < 0.0001, ns (non-significant) P > 0.05. Unless otherwise indicated statistical significance refers to comparison to the normoxic control. In parts (D, E and G), each dot represents a cell. A minimum of 100 cells was imaged per condition in all microscopy experiments. The two-tailed, unpaired Student's t-test was used in parts (A, D, E and G).

