Figure 2.
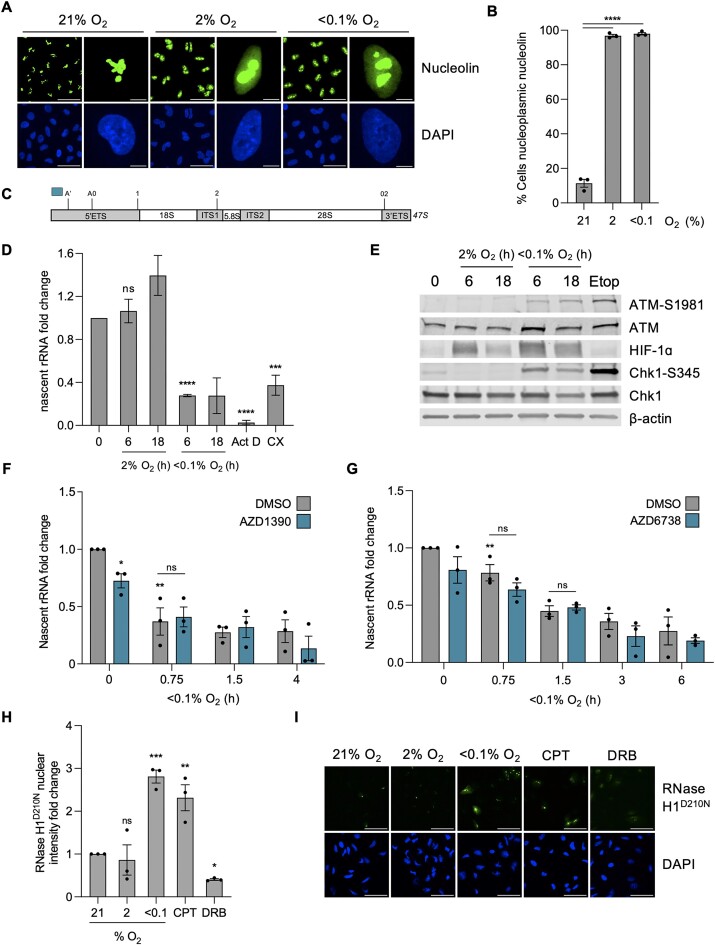
Hypoxia (<0.1% O2) leads to transcriptional stress independently of the DDR (A) A549 cells were exposed to 21, 2 or <0.1% O2 (6 h), fixed and stained for nucleolin (green) and DAPI (blue). Scale bar in field of view represents 50 μM. Scale bar in enlarged cell represents 5 μM. (B) Quantification of the percentage of cells with nucleoplasmic nucleolin from part (A). (C) Schematic of the initial product of RNPI transcription, 47S rRNA precursor. Initial cleavages occur at the A’ site in the 5′ETS (5′ externally transcribed spacer) region and at 02 site in the 3′ETS (3′ externally transcribed spacer) region before further cleavage (at sites A0, 1 and 2) and processing of the transcript, generating the mature 18, 28 and 5.8S. Blue bar indicates the amplicon from primers used to measure nascent 47S rRNA precursor levels, used subsequently in parts (D), (F) and (G). (D) HCT116 cells were exposed to 21, 2 or <0.1% O2 for the times indicated followed by RT-qPCR for the nascent 47S rRNA precursor. The rDNA transcription inhibitors Actinomycin D (Act D, 40 nM, 6 h) and CX5461 (CX, 100 nM, 6 h) were used as controls. (E) HCT116 cells were exposed to 21, 2 or <0.1% O2, for the times indicated, or etoposide (Etop) (25 μM, 6 h) followed by western blotting. β-Actin was used as a loading control. (F) HCT116 cells were pre-treated with ATM inhibitor AZD1390 (10 μM, 1 h) before being exposed to 21 or <0.1% O2 for the times indicated. RT-qPCR for the nascent 47S rRNA precursor is shown. ATM inhibition is confirmed in Supplementary Figure S2E. (G) HCT116 cells were pre-treated with ATM inhibitor AZD6738 (1 nM, 1 h) before being exposed to 21 or <0.1% O2 for the times indicated. RT-qPCR for the nascent 47S rRNA precursor is shown. ATM inhibition is confirmed in Supplementary Figure S2H. (H) A549 cells were transfected with V5-tagged RNase H1D210N and exposed to 21, 2 or <0.1% O2 (6 h). CPT (10 μM, 1 h) and DRB (100 μM, 1 h) were used as controls to increase and decrease R-loop levels, respectively. Staining for V5 was carried out and the nuclear intensity was determined. (I) Representative images for the data shown in part H. V5 (green) and DAPI (blue) are shown. Scale bar represents 50 μM. (A–I) Data from three independent experiments (n= 3), mean ± standard error of the mean (SEM) are displayed unless otherwise indicated. * P < 0.05, ** P < 0.01, *** P < 0.001, **** P < 0.0001, ns (non-significant) P > 0.05. Unless otherwise indicated statistical significance refers to comparison to the normoxic control. In parts (B), (D), (F)–(H), each data point represents the average from one of three biological repeats, normalized to the untreated sample. A minimum of 100 cells was imaged per condition in all microscopy experiments. The two-tailed, unpaired Student's t-test was used in parts (B), (D), (F)–(H).

