Figure 5.
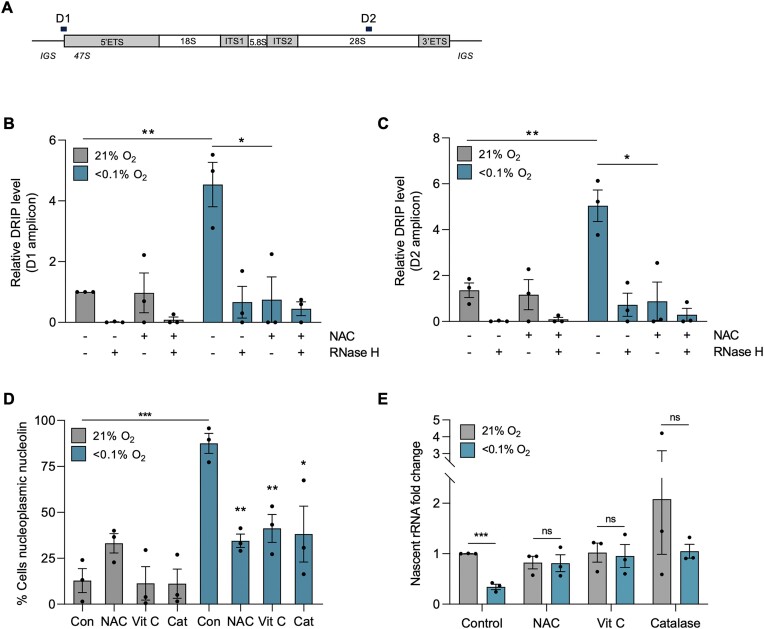
Hypoxia-induced transcriptional stress is ROS dependent. (A) rDNA repeat schematic with rDNA amplicons positions. D1 – 5′ rDNA promoter, D2 – 3′ 28S rRNA region. (B) DRIP-qPCR analysis of A549 cells exposed to 21 or <0.1% O2 (6 h), with and without NAC (20 mM). Treatment with recombinant RNase H was used to confirm R-loop specificity. The D1 amplicon was analyzed. Values were normalized to the normoxic control sample of D1. (C) as part B for D2 amplicon. Values were normalized to the normoxic control sample of D1. (D) A549 cells were treated with or without NAC (20 mM), Vitamin C (2 mM) or catalase (2000 U/mg), then exposed to 21 or <0.1% O2 (6 h), fixed and stained for nucleolin. The percentage of cells with nucleoplasmic nucleolin was quantified. Statistical significance is relative to the hypoxic (<0.1% O2) or normoxic (21% O2) control value. (E) A549 cells were treated with or without NAC (20 mM), Vitamin C (2 mM) or catalase (2000 U/mg) before being exposed to 21 or <0.1% O2 (6 h). RT-qPCR for the nascent 47S rRNA precursor is shown, normalized to untreated sample. (A–E) Data from three independent experiments (n= 3), mean ± standard error of the mean (SEM) are displayed unless otherwise indicated. * P < 0.05, ** P < 0.01, *** P < 0.001, **** P < 0.0001, ns (non-significant) P > 0.05. Unless otherwise indicated statistical significance refers to comparison to the normoxic control. In parts (B–E), each data point represents the average from one of three biological repeats. A minimum of 100 cells was imaged per condition in all microscopy experiments. The two-tailed, unpaired Student's t-test was used in parts (B) through (E).

