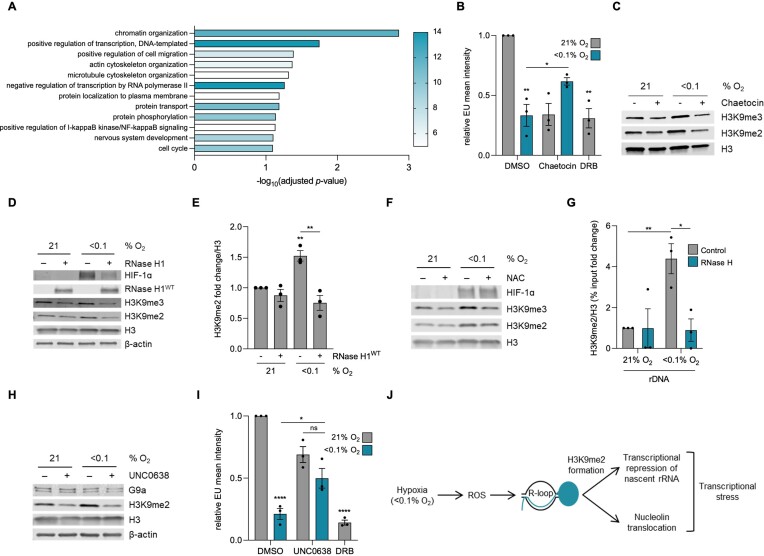
Figure 6.
Hypoxia-induced R-loops repress rDNA transcription by mediating H3K9me2 formation. (A) Genes with the most similar expression pattern to SETX in TCGA LUAD and LUSC datasets were analyzed using GeneCodis. The top 12 most significantly enriched pathways, from gene ontology biological pathway analysis, are shown. Color represents number of genes in the pathway. Genes in the ‘chromatin organization’ pathway are shown in Supplementary Table S2. (B) HCT116 cells were treated with DMSO or Chaetocin (1 μM), exposed to 21 or <0.1% O2 (6 h), and labeled with 5′EU (0.5 mM). The mean nuclear intensity per cell of 5′EU was quantified. DRB (100 μM, 6 h) was used as a control. Each data point represents the average 5′EU intensity from each of the three biological repeats. The two-tailed, unpaired Student's t-test was used. (C) HCT116 cells were treated with and without Chaetocin (1 μM) and exposed to 21 or <0.1% O2 (6 h), followed by western blotting. H3 was used as a loading control. Quantification of the western blot is shown in Supplementary Figure S5A, B. (D) A549 cells were transfected with mock or V5-tagged RNase H1WT and exposed to 21 or <0.1% O2 (4 h). RNase H1 over-expression was confirmed by western blot analysis. (E) Quantification of H3K9me2 from part D. The two-tailed, unpaired Student's t-test was used. Quantification of H3K9me3 is shown in Supplementary Figure S5C. (F) A549 cells were treated with NAC (20 mM) and exposed to 21 or <0.1% O2 (6 h), followed by western blotting. H3 was used as a loading control. Quantification of the western blot is shown in Supplementary Figure S5D, E. (G) ChIP-qPCR analysis of H3K9me2/H3 levels in A549 cells over-expressing RNase H1WT exposed to 21 or <0.1% O2 (6 h). The rDNA (D1) amplicon was analyzed. Values are calculated as a percentage of input, subtracted from the no antibody control value, and normalized to the D1 normoxic (21% O2) value. (H) A549 cells were pre-treated with UNC0638 (1 μM, 72 h) then exposed to 21 or <0.1% O2 (4 h) followed by western blotting. β-Actin and H3 were used as a loading control. Both the 165 kDa G9a-L and 140 kDa G9a-S isoforms are shown. (I) A549 cells were pre-treated with UNC0638 (3 μM, 20 h) then exposed to 21 or <0.1% O2 (6 h) and labeled with 5′EU (0.5 mM). The mean nuclear intensity of 5′EU was quantified. DRB (100 μM, 6 h) was used as a control. Each data point represents the average 5′EU intensity from each of the 3 biological repeats. The two-tailed, unpaired Student's t-test was used. (J) Hypoxia (<0.1% O2) leads to an increase in ROS which causes an accumulation of R-loops that contribute to the transcriptional stress response. The transcriptional stress response includes R-loop dependent translocation of nucleolin, and R-loop dependent deposition of H3K9me2 on rDNA that represses rDNA transcription. (A–J) Data from three independent experiments (n= 3), mean ± standard error of the mean (SEM) are displayed unless otherwise indicated. * P < 0.05, ** P < 0.01, *** P < 0.001, **** P < 0.0001, ns (non-significant) P > 0.05. Unless otherwise indicated statistical significance refers to comparison to the normoxic control. In parts (B), (E), (G) and (I), each data point represents the average from one of three biological repeats, normalized to the untreated sample. A minimum of 100 cells was imaged per condition in all microscopy experiments. The two-tailed, unpaired Student's t-test was used in parts (B), (E), (G) and (I).

