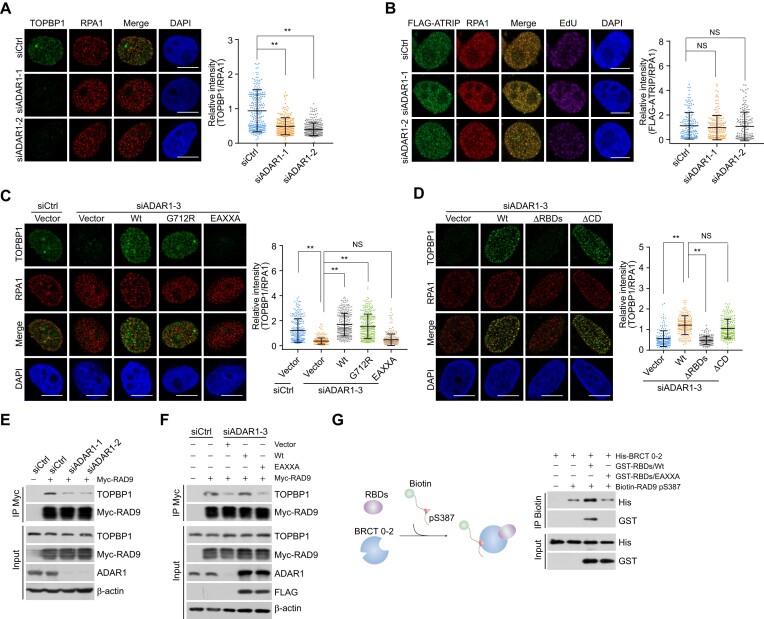
Figure 4.
ADAR1 controls the recruitment of TOPBP1 to replication stress sites. (A) Immunostaining and confocal microscopy analysis of TOPBP1 and RPA1 foci formation in ADAR1-depleted U2OS cells. Cells were treated with CPT for 1 h followed by pre-extraction and fixation. The intensity of TOPBP1 foci was quantified and normalized to that of RPA1 foci (n > 200). Scale bars, 10 μm. (B) Immunostaining and confocal microscopy analysis of the recruitment of FLAG- ATRIP at replication stress sites in HeLa cells expressing siRNAs against ADAR1. Cells were treated with CPT for 1 h followed by pre-extraction and fixation. The intensity of ATRIP foci was quantified and normalized to that in control cells (n > 100). Scale bars, 10 μm. (C, D) Immunostaining and confocal microscopy analysis of TOPBP1 and RPA1 foci formation in HeLa cells expressing ADAR1 5′UTR siRNA and the indicated stably integrated ADAR1 variants. Cells were treated with CPT for 1 h before collection. The intensity of TOPBP1 foci was quantified and normalized to that of RPA1 foci (n > 200 for C; n > 110 for D). Scale bars, 10 μm. (E) Co-IP analysis of the interaction between TOPBP1 and RAD9 in control or ADAR1-knockdown HeLa cells. (F) Co-IP analysis of the interaction between TOPBP1 and RAD9 in HeLa cells expressing ADAR1 5′UTR siRNA and the indicated ADAR1 variants. (G) Pull-down assays with biotinylated RAD9 pS387 peptides and the indicated recombinant proteins. ADAR1 RBDs/Wt or RBDs/EAXXA was incubated with TOPBP1 BRCT 0–2 followed by addition of the biotinylated RAD9 pS387 peptides. The protein complexes were then captured with streptavidin beads for immunoblotting. Data are mean ± SDs for (A–D) from biological triplicate experiments. **P < 0.01; NS, not significant; Kruskal–Wallis test for (A–D).

