
Figure 3.
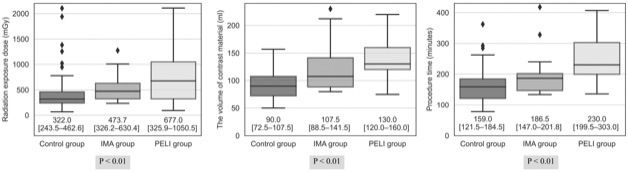
Box plots of the radiation exposure dose, volume of the contrast material, and procedure time in interventional procedures.
The boxes represent the inner quartiles, and the horizontal lines within the box indicate the median. The diamonds represent outliers (below the first quartile − 1.5 interquartile range, or above the third quartile + 1.5 interquartile range). P-values were calculated using one-way analysis of variance. The numbers under each box plot indicate the median and interquartile range (in square brackets).
IMA, inferior mesenteric artery; PELI, preemptive embolization of both lumbar arteries and IMA