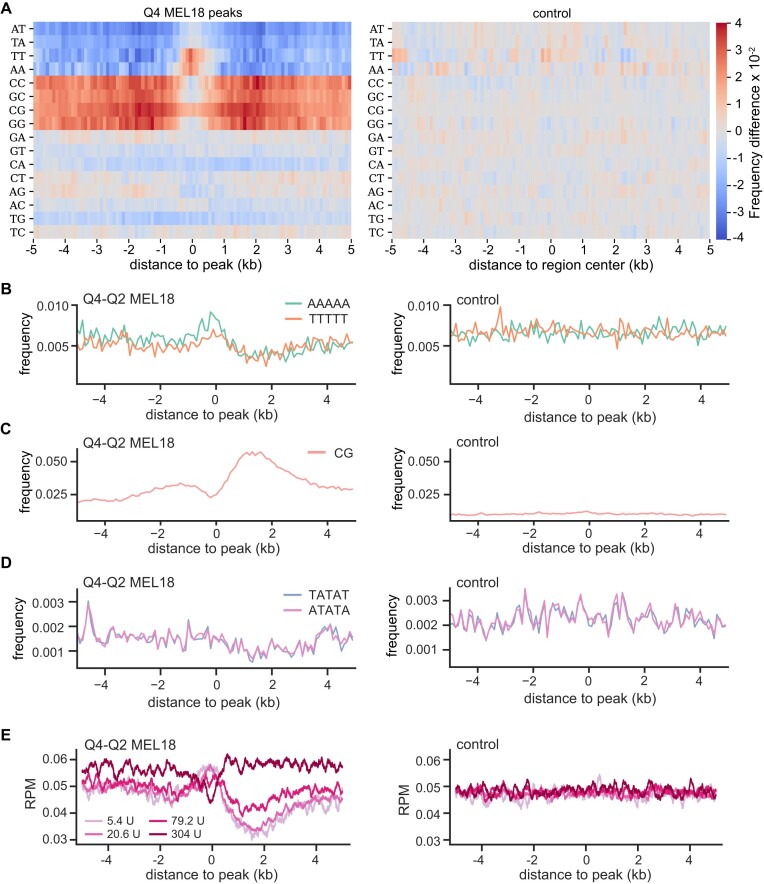
Figure 7.
DNA sequence features of PTEs. (A) Heat-map representation of the di-nucleotide frequency differences around high-occupancy (Q4) MEL18 peaks and randomly selected control sequences that do not bind PRC1 or PRC2. The control map is produced by calculating the frequency difference between randomly divided sequences of the control group. (B) The frequency of poly(dA)5 and poly(dT)5 within 100 bp windows around MEL18 peaks and within control DNA sequences. CpG frequency (C) and the frequencies of TATAT and ATATA oligonucleotides (D) for the same DNA sequences as in (B). (E) Mean MNase-seq profiles from MNase titration assay by (66) were plotted over the same regions as in (B). The MNase-seq signals are normalized for the sequencing depth. Note that regions underneath MEL18 peaks display increased MNase-seq signal in light-digested samples (treated with 5.4U and 20.6U of MNase) and a substantial reduction of the signal upon deep digestion (samples treated with 304U of MNase).

