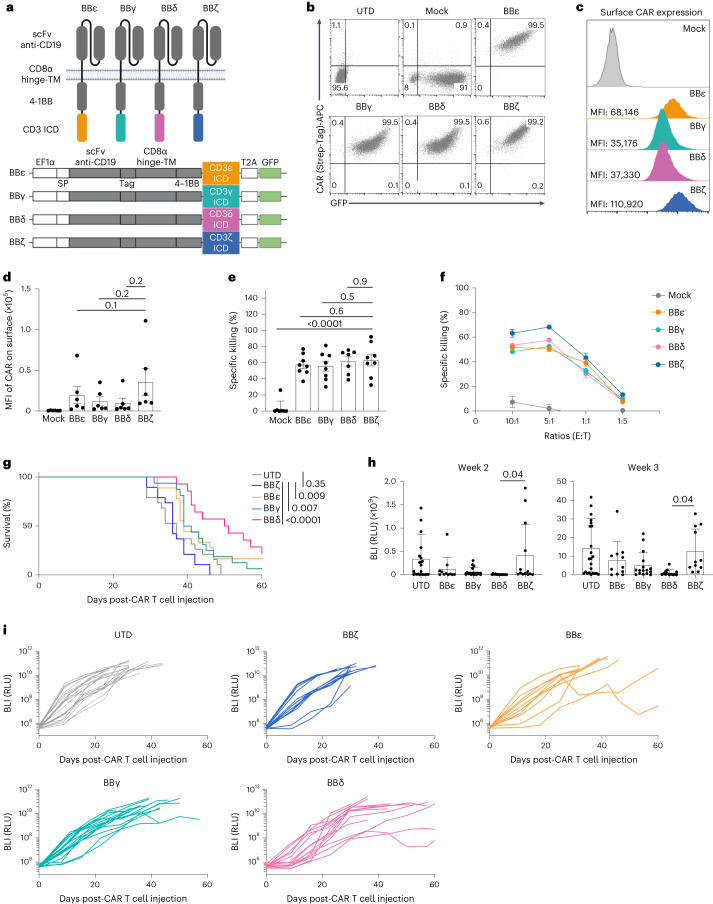
Fig. 1. CARs containing CD3δ/ε/γ ICD outperformed the CAR containing ζ.
a, Schematic representation of the CARs used. b–d, Percentage of positive CAR T cells (b) and surface CAR expression of GFP+ sorted cells from one representative donor (c) or from several donors pooled (d) (n = 6). e, Specific killing of CD19+ Nalm6 cells by primary human CAR T cells (1:1 ratio) for 6–8 h (n = 8, except for BBδ: n = 7). f, Specific killing at different cell-to-cell ratios (one representative donor from two is shown; n = 3 independent cocultures). g, The log(rank) Mantel–Cox survival test of Nalm6-bearing mice treated with CAR T cells sorted for GFP expression. h,i, Leukemia progression (average radiance) from weeks 2 and 3 post-CAR T cell injection (h) and average radiance analyzed through a 60-d period (i) (n = 11–24 mice pooled from 3 independently performed experiments). Each dot represents an independent donor (d and e) or mouse (h). Data are represented as mean ± s.d. One-way ANOVA followed by Dunnett’s multiple-comparison test (d, e and h) was used. APC, allophycocyanin. UTD, untransduced cells.

