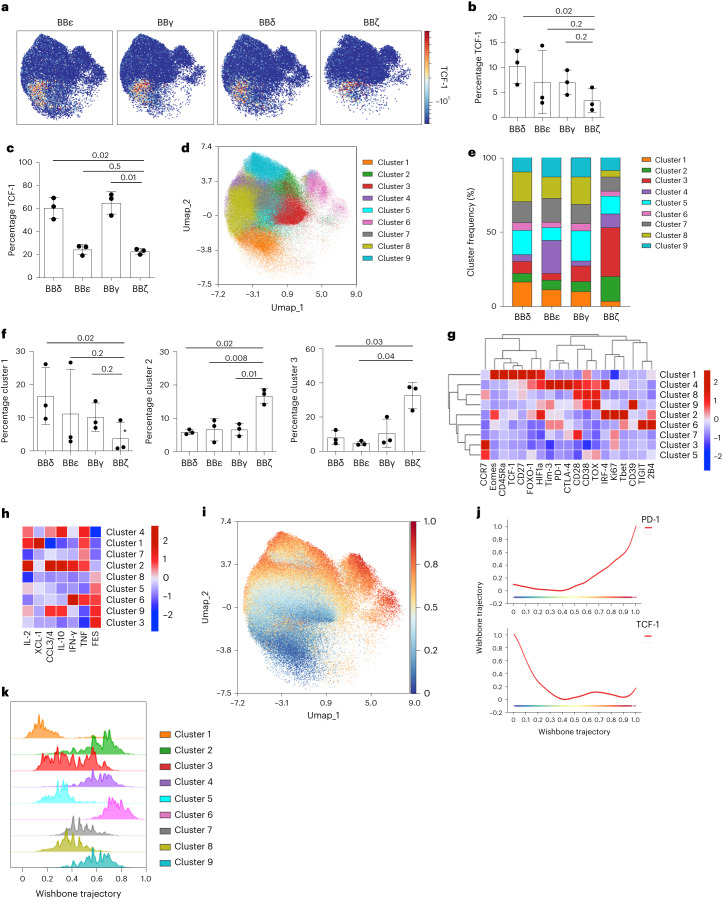
Fig. 5. BBδ CAR T cells maintain precursors expressing TCF-1.
a, UMAP visualization from CyTOF data of CAR+ T cells on serial antigen encounters. Color indicates TCF-1 expression (n = 3). b,c, Frequency of TCF-1-expressing CAR T cells assayed by CyTOF (b) (n = 3) and by intracellular flow cytometric analysis (c) (n = 3). d, FlowSOM clustering of CAR T cells. Clusters are visualized by the indicated colors on the UMAP plot. e, Stack bar graph displaying the median frequency of each cluster. f, Cluster frequency of selected clusters (n = 3). g, Hierarchically clustered heatmap indicating the percentage of expression of activation and exhaustion markers per cluster. h, Heatmap showing the percentages of cytokine-expressing CAR T cells per cluster ordered by increasing FES. i, Wanderlust trajectory analysis, with progressing trajectory pseudotime color visualized on the UMAP. j, PD-1 (top) and TCF-1 (bottom) expression according to the Wanderlust trajectory. k, Stacked bar histogram indicating the position of the indicated cluster cells according to the trajectory. Each dot represents an independent donor (b, c and f). Data are represented as mean ± s.d. One-way ANOVA followed by Dunnett’s multiple-comparison test was used.

