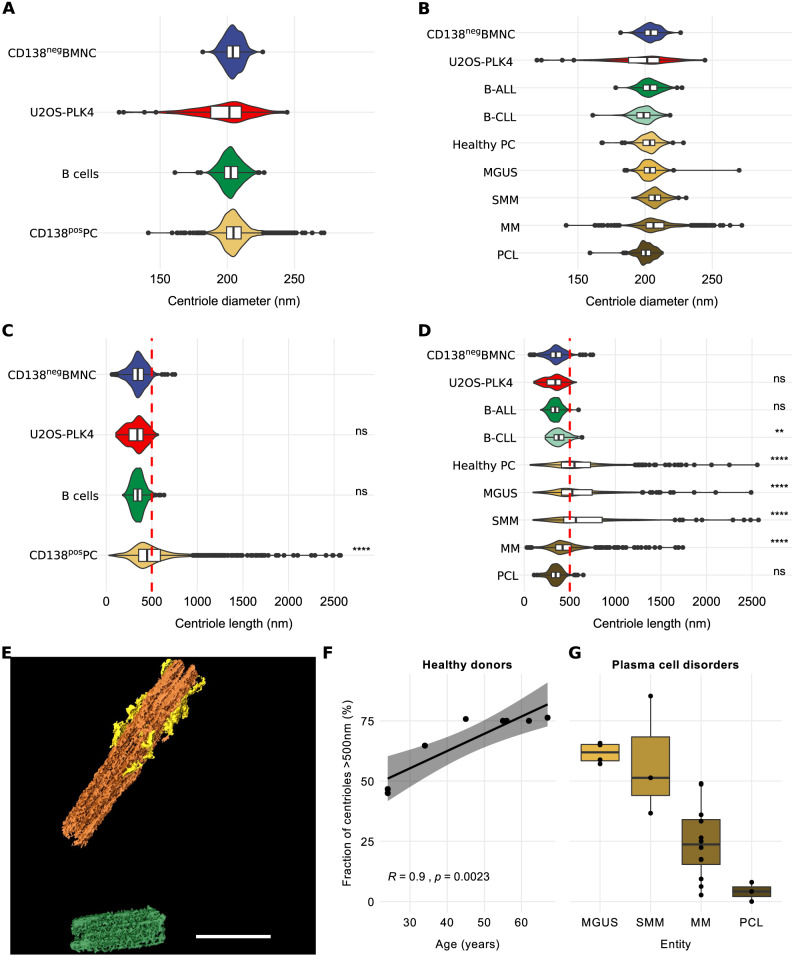
Fig. 1. Over-elongation of centrioles increases with age in human plasma cells and decreases with increasingly aggressive stages of plasma cell disorders.
A Violin plots and integrated box plots showing the distribution of centriole diameters in normal CD138neg bone marrow mononuclear cells, U2OS-PLK4 cells, B-cells from patients with B-ALL or B-CLL, and CD138pos plasma cells from healthy donors and patients with plasma cell disorders. B Distribution of centriole diameters in normal CD138neg bone marrow mononuclear cells, U2OS-PLK4, B-cells from patients with B-ALL or B-CLL, and CD138pos plasma cells. Centriole diameters in cells from healthy donors, and patients with MGUS, SMM, MM, and PCL are depicted separately. C Violin plots and integrated box plots showing the distribution of centriole lengths of individual centrioles from normal CD138neg bone marrow mononuclear cells, U2OS-PLK4, B-cells from patients with B-ALL or B-CLL, and CD138pos plasma cells from healthy donors and patients with plasma cell disorders. The cut-off value for over-elongation of 500 nm is displayed as red dashed line. D Distribution of centriole lengths in normal CD138neg bone marrow mononuclear cells, U2OS-PLK4, B-cells from patients with B-ALL or B-CLL, and CD138pos plasma cells from healthy donors. Centriole lengths in cells from patients with MGUS, SMM, MM, and PCL are depicted separately. The cut-off value for over-elongation of 500 nm is displayed as red dashed line. E 3D visualization of an exemplary over-elongated centrosome using Amira-Avizo software. The mother centriole (orange) shows over-elongation (total length: 1654 nm) and supernumerary subdistal appendages (yellow). One over-elongated daughter centriole (length: 712 nm) is displayed in green. Scale Bar, 500 nm. F Scatter plot of donor age and fraction of over-elongated centrioles in CD138pos plasma cells from 8 healthy donors. The fitted line, R and p values were obtained by linear regression. G Fraction of over-elongated centrioles in CD138pos plasma cells from MGUS, SMM, MM, and PCL patients displayed as a box plot. For A–D, individual centriole measures of all biological samples are pooled into one group and statistical analysis were applied to the entire groups. The Wilcoxon rank sum test was used in panels (C, D) for pairwise comparison of all groups to the CD138neg BMNC, which served as reference. ns not significant. **p < 0.01. ****p < 0.0001. N (individual centrioles) for panels A–D: CD138neg bone marrow mononuclear cells (205), U2OS-PLK4 (137), B-cells (380), CD138pos plasma cells (1386), B-ALL (289), B-CLL (91), healthy plasma cells (275), MGUS (158), SMM (101), MM (739), PCL (113). N (biological replicates) for F and G: healthy donors (8), MGUS (4), MM (12), SMM (3), PCL (3).

