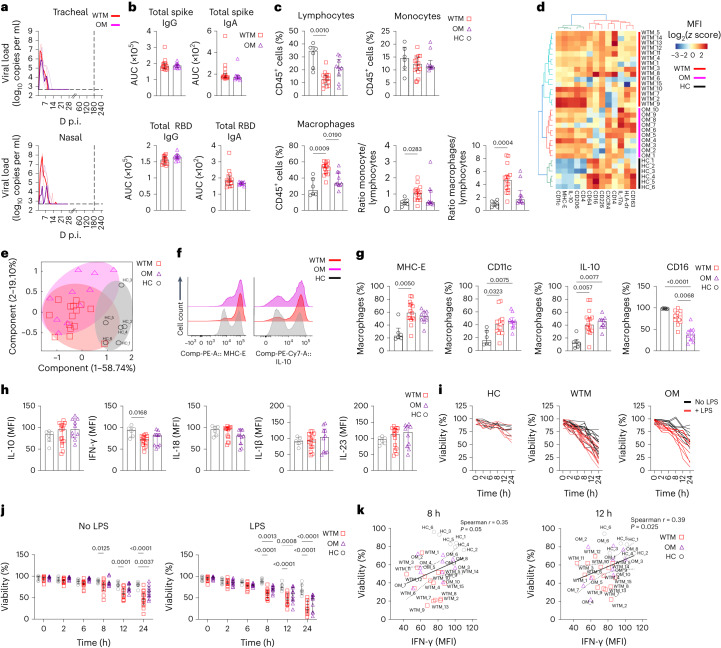
Fig. 1. Increased expression of MHC-E and IL-10 in BALF Mac from SARS-CoV-2-infected macaques.
a, PCR quantification of tracheal and nasal swab viral loads in 25 cynomolgus macaques infected with wild-type SARS-CoV-2 (WTM, n = 15) or Omicron variants (OM, n = 10) at a median of 221 d p.i. b, Plasma titers of spike and RBD IgG and IgA in WTM and OM at 221 d p.i. (median). c, Percentage and ratio of lymphocytes, monocytes and macrophages in BALF from HC, WTM and OM at a median of 221 d p.i. d, Hierarchical clustering heatmaps displaying log2 z score expression of proteins in BALF Mac from HC, WTM and OM at a median at a median of 221 d p.i. e, PCA of protein expression in BALF Mac as in c depicting clustering patterns among macaques. f, Expression of MHC-E (top) and IL-10 (bottom) in BALF Mac as in c. g, Frequency of MHC-E, CD11c, IL-10 and CD16 in BALF Mac as in c. h, Median expression per cell of cytokines in BALF Mac after 8-h LPS stimulation isolated from infected macaques as in c. i,j, Viability of BALF Mac isolated as in c, and cultured with and without LPS stimulation. k, Spearman correlation analysis between intracellular IFN-γ expression and viability at 8 and 12 h post-LPS exposure in BALF Macs as in c. Each symbol represents an individual macaque. In all graphs, bars indicate medians and interquartile ranges are displayed. Statistical tests: Mann–Whitney (b), Kruskal–Wallis with Dunn’s post hoc test (c, g and h) and nonparametric Wilcoxon signed-rank test (k). Linear regression lines and confidence intervals are shown in correlation analyses.

