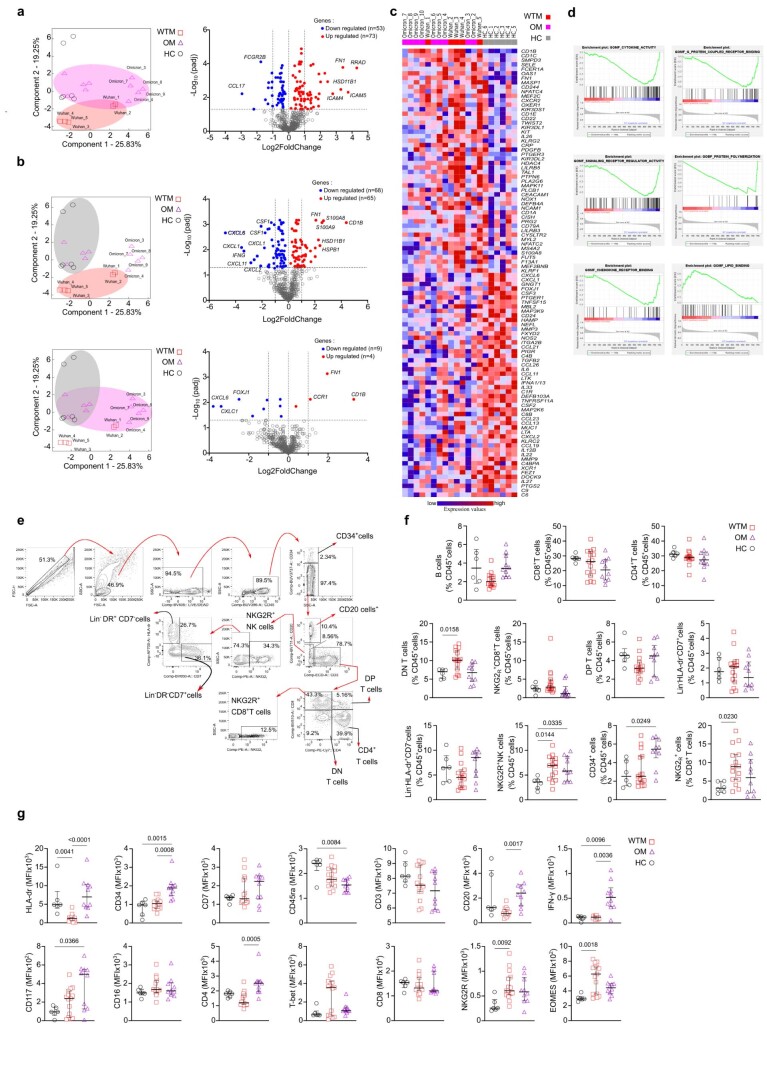
Extended Data Fig. 4. In-vitro transcriptome analyses of BALF macrophages.
CD64+ macrophages were isolated from BALF of 5 HC, 5 randomly selected WTM, and 10 OM at least 221 days p.i. After 8 hours of culture, they were profiled using the nanoString nCounter System. (a) Principal Component Analysis (PCA) shows clustering patterns of convalescent monkeys. OM samples are represented by purple triangles and WTM samples by red squares. Volcano plots highlight genes significantly up-regulated and down-regulated between WTM and OM. (b) Similar to (a), volcano plots highlight genes significantly up-regulated and down-regulated between WTM and HC (up) or between OM and HC (down). (c) Heat map displays the top 50 genes resulting from Gene Set Enrichment Analysis (GSEA) conducted on the Hallmark gene sets obtained in (a). (d) Enrichment plots show data sets enriched in GSEA Hallmark analysis of CD64+ Mac as in (a), displaying the running Enrichment Score (ES) and positions of gene set members on the rank-ordered list. (e) Gating strategy defines different lymphocyte populations in BALF of HC, WTM, and OM at least 221 days p.i. Populations are defined based on specific marker expression. (f) Comparison of various lymphocyte populations in BALF of HC, WTM, and OM. (g) Comparison of marker expression on BALF CD45+ lymphocytes as described in (e). In each graph, individual symbols represent individual monkeys, bars indicate medians, and interquartile ranges are shown. p-Values were determined using a Kruskal-Wallis test with Dunn’s post-test in (f) and (g).

