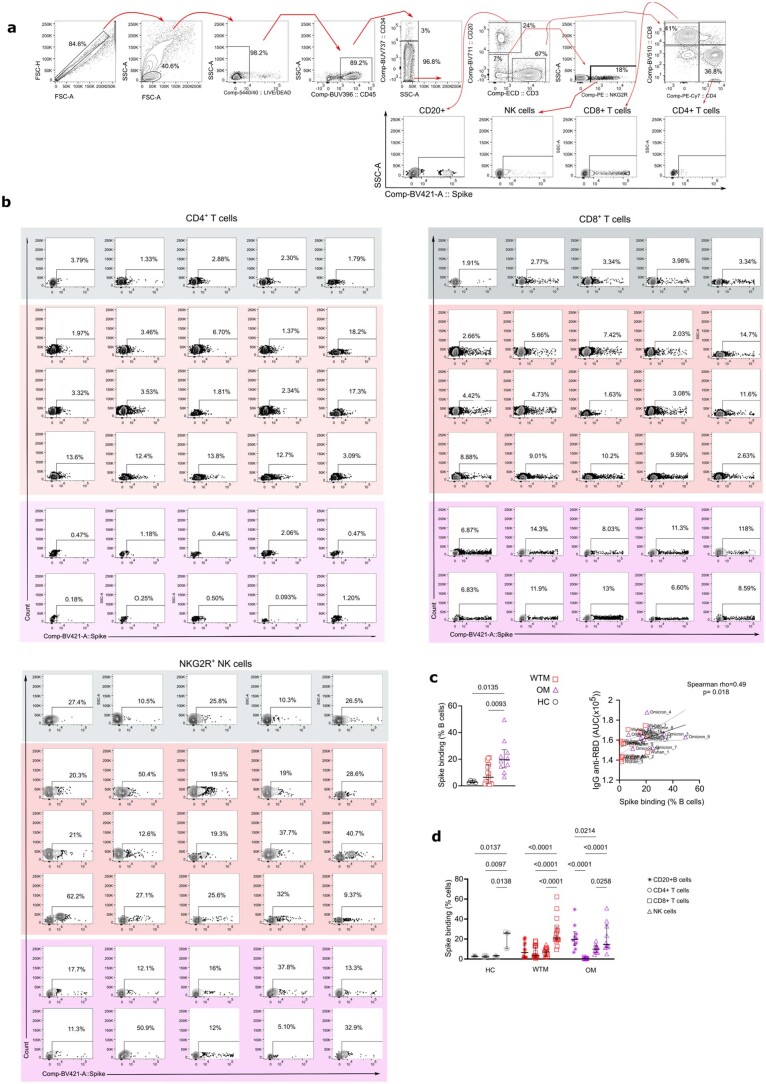
Extended Data Fig. 7. SARS-CoV-2 spike protein binding on lymphocytes.
(a) Representative flow cytometry plots showing the gating strategy for trimeric spike surface staining on total BALF cells from HC, WTM, and OM at ≥221 days p.i. Populations are defined based on specific marker expression. (b) Dot plot illustrating the percentage of surface trimeric spike staining on CD4+ T cells, CD8+ T cells, and NKG2R+ NK cells from HC, WTM, and OM. Dot plots are color-coded for clarity. (c) Left: graph displaying the percentage of CD20+ B cells positive for trimeric spike surface staining in total BALF cells from HC, WTM, and OM at ≥221 Days p.i. Right: positive Spearman correlation between the percentage of cells stained with trimeric spike among BALF CD20+ B cells and the amount of IgG anti-RBD measured in the plasma as in Fig. 1. (d) Graph showing the percentage of CD4+ T cells, CD8+ T cells, and NK cells positive for trimeric spike surface staining in BALF cells from HC, WTM, and OM at ≥221 Days p.i. In Spearman correlation, the black solid line represents linear regression, and the dotted line indicates the confidence interval (95%). Each point is labeled with the corresponding monkey’s name. In each graph, dots, squares, or triangles represent individual monkeys, bars indicate medians, and interquartile ranges are shown. p-Values were determined using a Kruskal-Wallis test with Dunn’s post-test.

