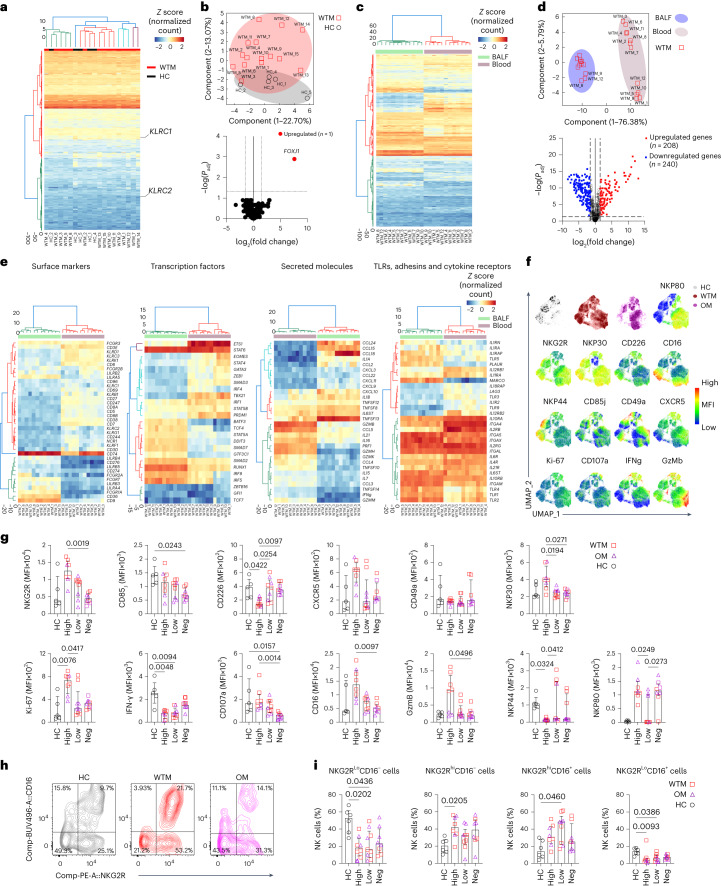
Fig. 6. Expression of FoxJ1 is upregulated in BALF NKG2R+ NK cells.
a, Heatmap of gene expression profiles in NKG2R+ NK cells from BALF of 15 WTM and 5 HC at ≥461 d p.i., based on mRNA counts normalized z scores via the nanoString nCounter System. b, PCA (top) and volcano plot (bottom) showing differentially expressed genes in BALF NKG2R+ NK cells, as in Fig. 4a. Dotted lines indicate significance thresholds (Padj = 0.05; log(fold change) >1 or < −1). c, Heatmap of gene expression in BALF compared to blood NKGR+ NK cells from 12 paired WTM samples based on z scores as in Fig. 4a. d, PCA (top) and volcano plot (bottom) showing genes upregulated or downregulated between blood and BALF NKGR+ NK cells as in Fig. 4c. Dotted lines indicate significance thresholds. e, Heatmaps of significantly altered mRNAs for various markers and receptors in specific cell populations and tissues. f, UMAP analysis of CD45+CD14−CD3−CD20−NKG2R+ lymphocytes from BALF of WTM, OM and HC. Manually gated lymphocyte populations are color-coded. g, MFI of surface markers and cytokines in BALF NKG2R+ NK cells from WTM, OM and HC at ≥461 d p.i. h,i Contour plots (h) and frequency (i) of distinct NKG2R/CD16 NK cell subpopulations in HC and WTM (as OM) at ≥461 d p.i. Cluster distance values are determined with the Euclidean method. For all graphs, symbols represent individual macaques; bars indicate medians. Interquartile ranges are shown. P values determined by Kruskal–Wallis test with Dunn’s post hoc test.

