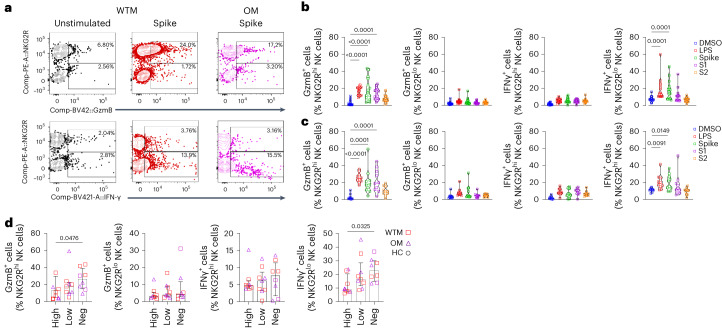
Fig. 7. NK cell IFN-γ production following spike stimulation.
a, Representative GzmB and IFN-γ expression plots in NKG2Rlo and NKG2Rhi NK cells from WTM (n = 15) and OM (n = 10), isolated ≥221 d p.i., cultured with or without spike protein. b,c, GzmB and IFN-γ expression in NKG2Rhi and NKG2Rlo NK cells from WTM (b) and OM (c), isolated ≥221 d p.i., cultured with DMSO, LPS, trimeric spike, spike domain S1 or spike domain S2. d, GzmB and IFN-γ expression in NKG2Rhi and NKG2Rlo NK cells from WTMneg, WTMlo, WTMhi, OMneg, OMlo and OMhi, isolated ≥221 d p.i., and cultured with spike protein for 24 h. Each symbol represents an individual; bars represent medians. Interquartile ranges are shown. In all graphs, P values were determined by Kruskal–Wallis test with Dunn’s post hoc test.

