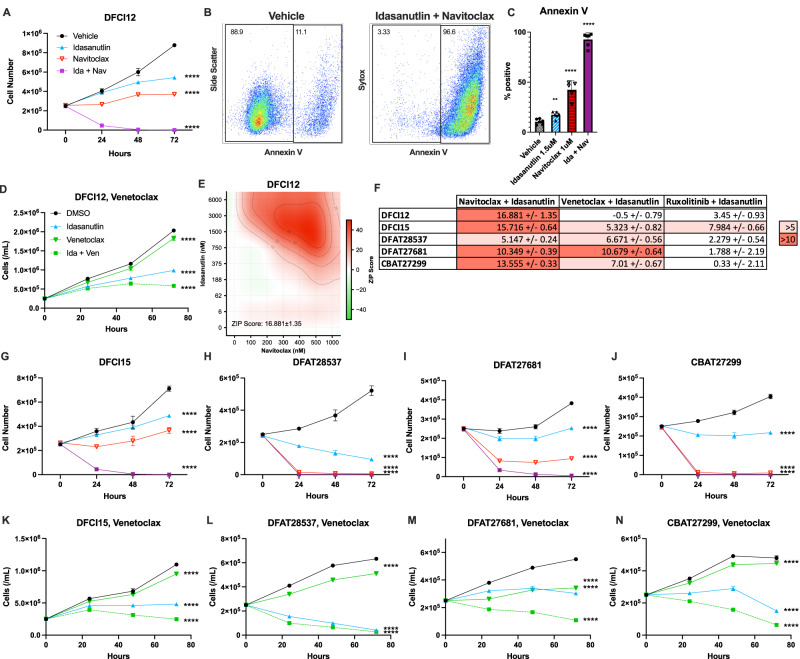
Fig. 3. The combination of idasanutlin and navitoclax has synergic activity against T-ALL PDX lines in vitro.
A DFCI12 cells were treated in vitro over 72 h with vehicle, idasanutlin (1.5 μM), navitoclax (1 μM), or combination therapy and cell number quantified. B Representative flow plot for Annexin V staining of vehicle (left) and dual-treated (right) cells following 48 h of treatment. C Percent apoptotic cells by Annexin V positivity following 48 h of treatment. D DFCI12 cells were treated in vitro over 72 h with vehicle, idasanutlin (1.5 μM), venetoclax (1 μM), or combination therapy and cell number was quantified. E DFCI12 cells were treated with increasing doses of idasanutlin (vehicle, 6 nM, 60 nM, 188 nM, 375 nM, 750 nM, 1.5 μM, 3 μM, 6 μM) and navitoclax (vehicle, 100 nM, 200 nM, 300 nM, 500 nM, 500 nM, 1 μM) to generate a dose-response matrix and evaluate for ZIP synergy score with SynergyFinder 2.0. Representative panel from two independent experiments. F Zip synergy scores for the indicated T-ALL PDX line based on dose-response matrix data testing the indicated drug combination. Primary data are presented in Figs. S2–4. DFCI15 (G), DFAT28537 (H), DFAT27681 (I), or CBAT27299 (J) cells were treated in vitro over 72 h with vehicle, idasanutlin (1.5 μM), navitoclax (1 μM), or combination therapy and cell number quantified. DFCI15 (K), DFAT28537 (L), DFAT27681 (M), or CBAT27299 (N) cells were treated in vitro over 72 h with vehicle, idasanutlin (1.5 μM), venetoclax (1 μM), or combination therapy and cell number quantified. All experiments performed in triplicate with at least two independent experiments. Error bars represent SEM (**** ≤ 0.0001, *** ≤ 0.001, ** ≤ 0.01, * ≤ 0.05 compared to DMSO). A Two-way ANOVA, C unpaired t-test, D two-way ANOVA, E, F Zero Interaction Potency Score, G–N two-way ANOVA.

