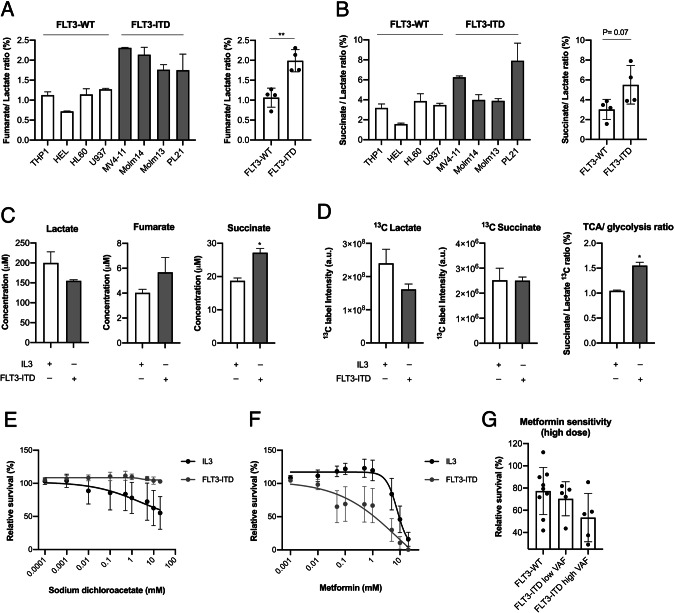
Fig. 1. FLT3-ITD cells display high OXPHOS metabolism and are sensitive to mitochondrial inhibition.
Representative NMR measurements of fumarate/lactate ratio (A) and succinate/lactate ratio (B) (TCA/glycolysis) in FLT3-ITD compared to FLT3-WT AML cell lines (n = 2 biological replicates). C Representative NMR measurements of lactate, succinate and fumarate levels in 32D cells under the influence of FLT3-ITD kinase activity in comparison to IL3 stimulation (24 h stimulation) (n = biological replicates). D NMR measurements of 13C label incorporation into succinate and lactate (together with their ratio) after 24 h of labelling with 13C glucose (n = 2 technical replicates). E Cellular sensitivity to sodium dichloroacetate in 32D cells under IL3 compared to FLT3-ITD signaling (treated for 72 h) (n = 3). F IC50 curve of metformin sensitivity in 32D cells under IL3 compared to FLT3-ITD signaling (treated for 72 h) (n = 5). G Metformin sensitivity in FLT3-ITD-positive vs FLT3-WT primary AML blasts (5 mM for 72 h) (n = 10 and 9, respectively). Data are presented as mean values ± SD. In (B) and (C), unpaired Student’s t-test was performed (**P ≤ 0.01, *P ≤ 0.05).

