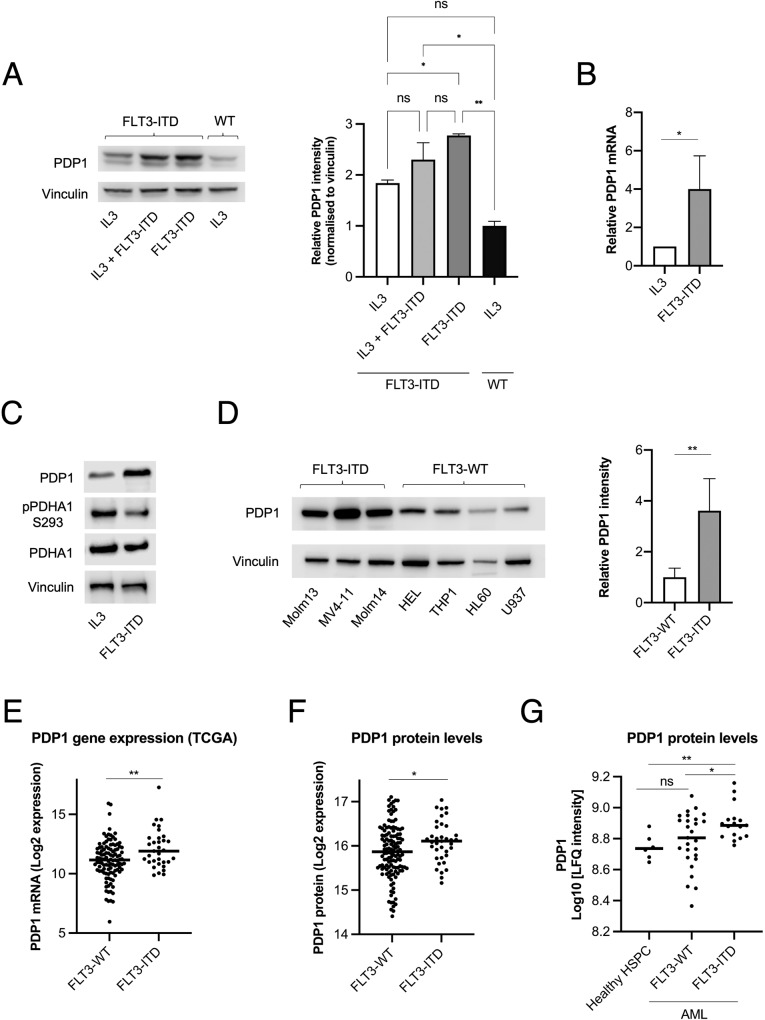
Fig. 2. FLT3-ITD cells express high PDP1 levels.
A PDP1 protein levels in 32D cells under FLT3-ITD kinase activity, IL3 signaling or their combination (n = 2). B qPCR measurements of PDP1 mRNA levels in 32D cells under FLT3-ITD vs IL3 signaling (n = 4). C Western blot of S293 inhibitory phosphorylation levels of PDHA1 (n = 3). D PDP1 protein levels in FLT3-ITD-positive AML cell lines compared to their FLT3-WT counterparts (n = 2). E PDP1 mRNA expression levels in primary AML blasts (FLT3-WT vs FLT3-ITD, n = 108 and 33, respectively) extracted from the TCGA AML cohort (https://tcga-data.nci.nih.gov/tcga). F PDP1 protein levels in AML blasts (FLT3-WT vs FLT3-ITD) (n = 37 and 128, respectively) extracted from the AML proteogenomic cohort [52] (https://www.cell.com/cancer-cell/fulltext/S1535-6108(22)00058-7). G PDP1 protein levels in primary AML CD34+ cells and healthy CD34+ HSPCs (Healthy HSPCs vs FLT3-WT vs FLT3-ITD, n = 6, 17 and 27, respectively) extracted from Boer et al. 2018 [53] (https://www.cell.com/cancer-cell/fulltext/S1535-6108(18)30374-X). Data are presented as mean values ± SD. In (D), (E) and (F), unpaired Student’s t-test was performed (**P ≤ 0.01, *P ≤ 0.05). In (A) and (G), one-way ANOVA with Bonferroni’s multiple comparisons was performed (**P ≤ 0.01, *P ≤ 0.05).

