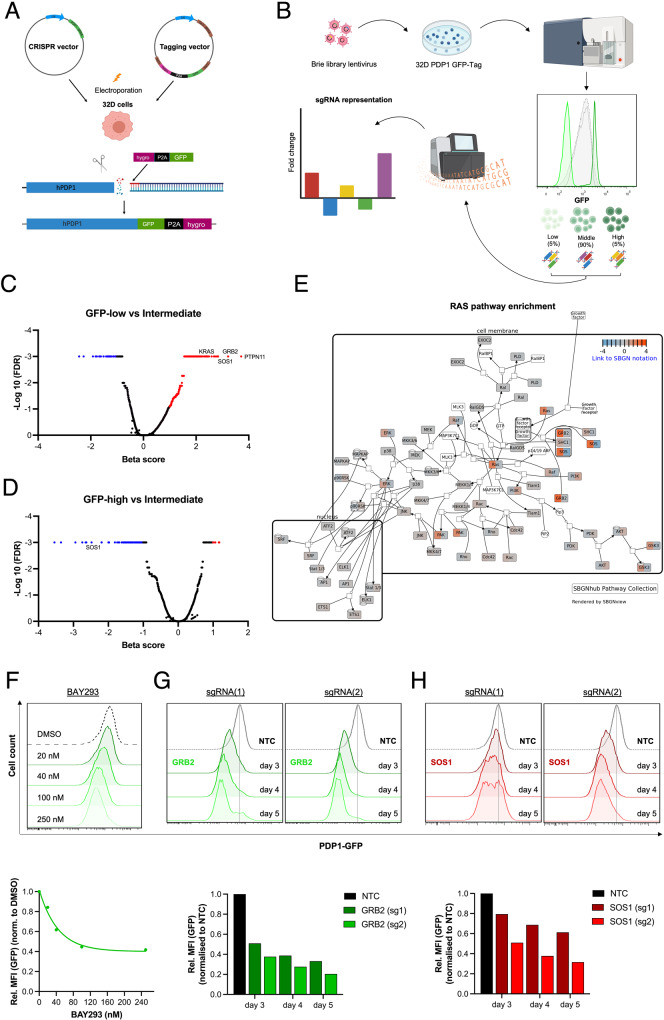
Fig. 3. Endogenous tagging of PDP1 reveals the role of RAS signaling in mediating FLT3-ITD-induction of PDP1 expression.
A General strategy of PDP1 tagging using a CRISPR vector to induce a double strand break at the C-terminus of the gene locus and a generic tagging vector to incorporate a GFP gene sequence. B Experimental design of the CRISPR screen and FACS sorting of the cells into 3 subpopulations according to their GFP florescence intensity (lowest 5%, intermediate 90% and highest 5%). Parts of the figure were designed using BioRender. C Volcano plots of significantly enriched genes in the GFP-low population compared to the middle 90%, and (D) of the significantly depleted genes in the GFP-high cells compared to the intermediate 90% population. E Graphical illustration of the RAS pathway genes and their enrichment scores in the GFP-low cells. F Flowcytometry analysis of PDP1 levels in PDP1-tagged 32D FLT3-ITD cells upon treatment with the KRAS-SOS inhibitor (BAY-293). G PDP1 levels in PDP1-tagged 32D FLT3-ITD cells after GRB2 or (H). SOS1 knockouts (measured by flowcytometry of PDP1-GFP tag). Quantitative mean florescence intensity (MFI) values are also shown.

