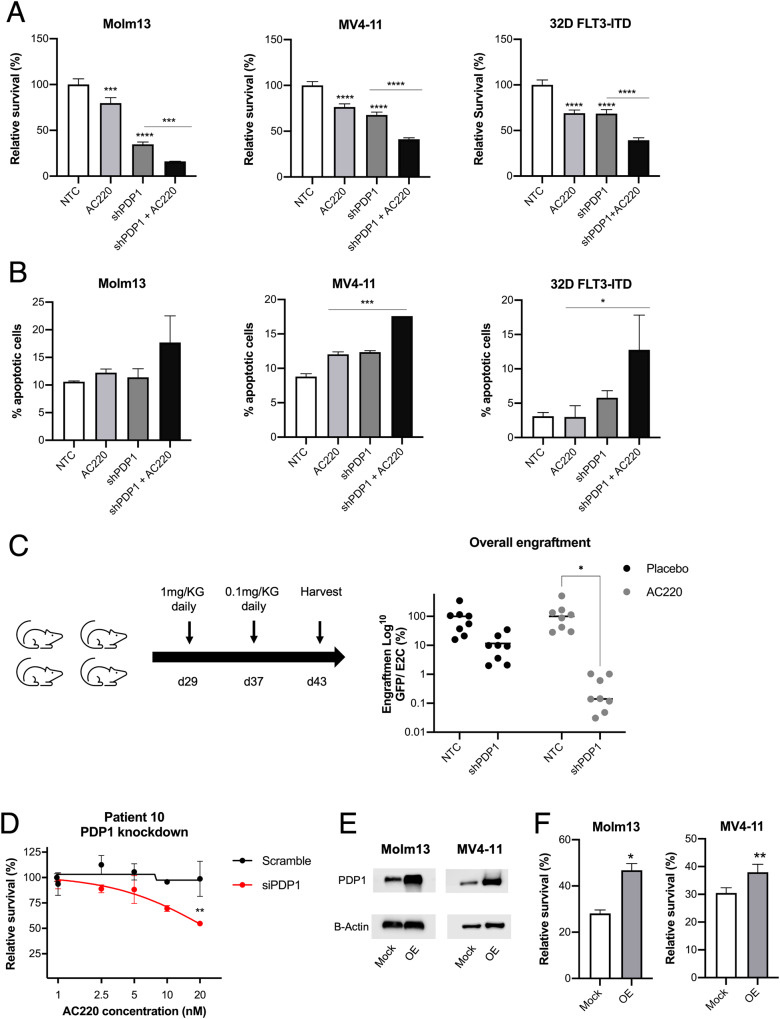
Fig. 7. PDP1 is a resistance mechanism to FLT3-inhibition.
A Combinatorial effect of PDP1 knockdown and FLT3-inhibition with 1 nM AC220 for 24 h in Molm13, MV4-11 and 32D FLT3-ITD cells (representative experiment, n = 2 biological replicates). B Apoptosis levels upon PDP1 knockdown in combination with AC220 treatment (1 nM for 24 h) (representative experiment, n = 2 biological replicates). C In vivo competition assay of GFP-positive NTC and shPDP1 MV4-11 cells mixed, each, in 1:1 ratio with E2C-positive NTC cells and transplanted into NSG mice (n = 8 per group) (5*105 cell per mouse). Each group (NTC:NTC and NTC:shPDP1) was either treated with AC220 or DMSO (placebo) as shown in the scheme. Total engraftment is shown as a ratio between GFP and E2C. D AC220 sensitivity (48 h treatment) upon PDP1 knockdown using an siRNA approach in primary AML blasts from an AC220-resistant patient. This experiment was performed once on freshly aspirated peripheral blasts. E Western blot of PDP1 overexpression in Molm13 and MV4-11 cells. F AC220 sensitivity in Molm13 and MV4-11 cells upon PDP1 overexpression (1.5 nM AC220 for 72 h) (representative experiment, n = 2–3 biological replicates). Data are presented as mean values ± SD. In (A) and (B), one-way ANOVA with Bonferroni’s multiple comparisons was performed (****p ≤ 0.0001, ***p ≤ 0.001, *p ≤ 0.05). In (C and D), two-way ANOVA with Bonferroni’s multiple comparisons was performed (*p ≤ 0.05). In (F), unpaired Student’s t-test was performed (**p ≤ 0.01, *p ≤ 0.05).

