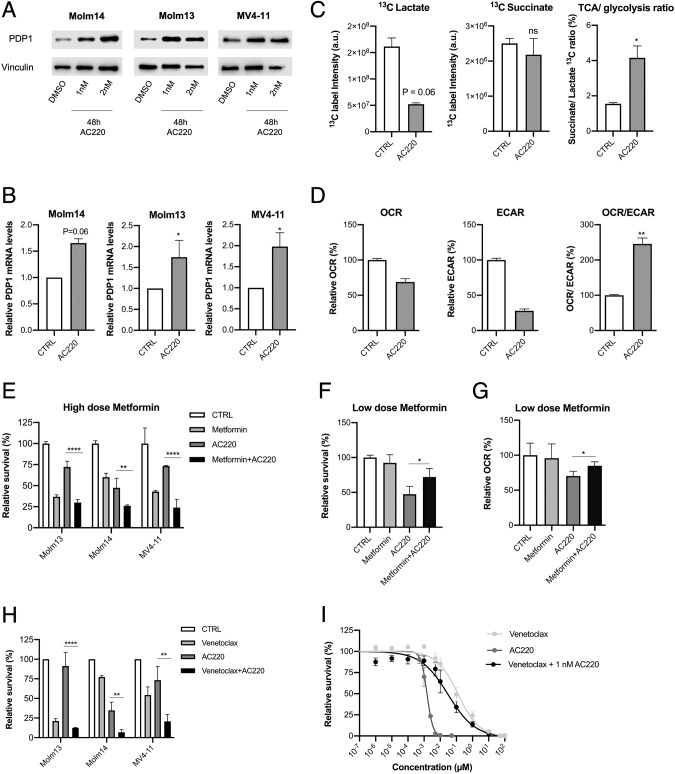
Fig. 8. PDP1 is upregulated upon FLT3-inhibition as a survival strategy.
A Western blot of PDP1 levels upon FLT3-inhibition. B qPCR measurements of PDP1 mRNA levels upon FLT3-inhibition (normalized to RPII levels) (n = 2–4). C NMR measurements of succinate and lactate 13C intensity and their ratio after 24 h of labelling with 13C glucose (n = 2 technical replicates). D Representative Seahorse measurements of OCR, ECAR and their ratio upon FLT3-inhibition (the experiment was repeated twice). E Synergism of high dose of metformin (5 mM) with AC220 (1 nM) (72 h treatment) (normalized to untreated control) (representative experiment is shown out of 3 biological replicates). F Low dose of metformin (50 μM) antagonizes the effects of AC220 (1 nM) in Molm14 cells (72 h treatment) (representative experiment is shown out of 2 biological replicates). G OCR measurements in Molm14 cells treated with AC220 (1 nM) and low dose metformin (50 μM) (24 h treatment) (representative experiment is shown out of 2 biological replicates). H Synergism of venetoclax (10 nM) and AC220 (1 nM) (72 h treatment) in FLT3-ITD AML cell lines (normalized to untreated control) (n = 3 biological replicates). I Dose response curve of venetoclax and AC220 in Molm14 cells. Venetoclax + AC220 combination was performed with a fixed concentration of AC220 (1 nM) (n = 3). Data are presented as mean values ± SD. In (C) and (D), unpaired Student’s t-test was performed (**p ≤ 0.01, *p ≤ 0.05). In (E–H), one-way ANOVA with Bonferroni’s multiple comparisons was performed (****p ≤ 0.0001, **p ≤ 0.01, *p ≤ 0.05).

