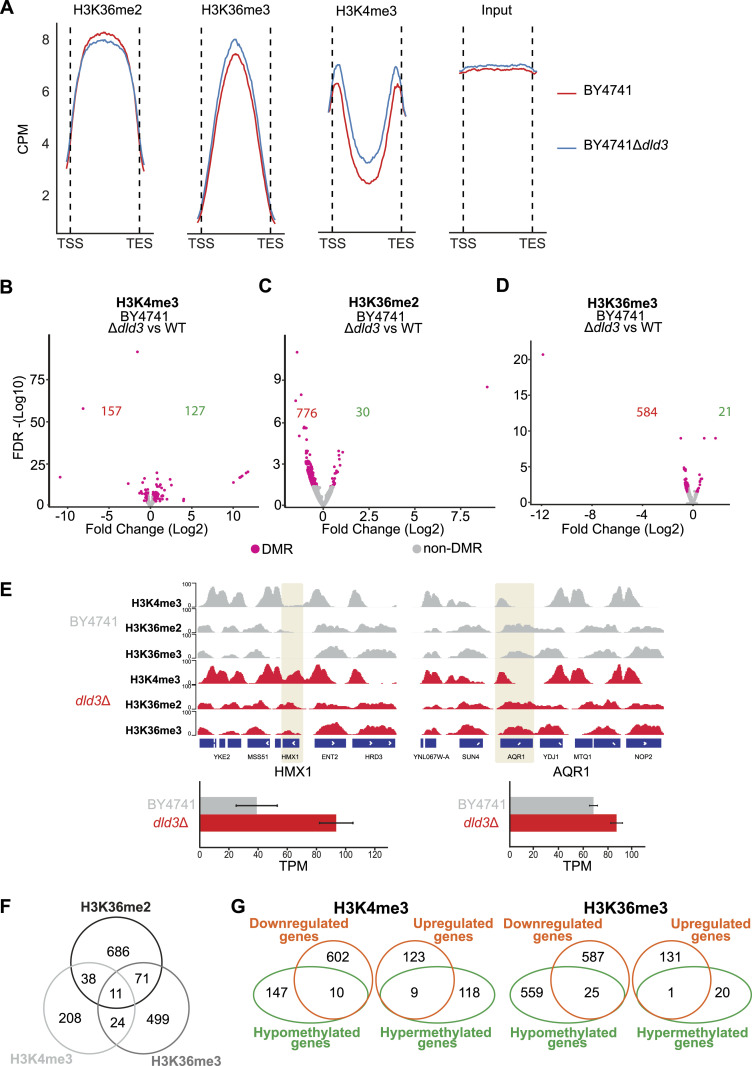
Figure 2. 2-HG accumulation induces locus-specific changes in H3K36 and H3K4 methylation.
(A) Metagene plots depict the binned median signal from transcription start sites to transcription end sites of all genes for H3K36me2, H3K36me3, H3K4me3, and input from BY4741 WT and BY4741 dld3Δ strains. Increase in the H3K36me3 and H3K4me3 methylation is observed upon accumulation of 2-HG, whereas a decrease is observed for the H3K36me2 signal. (B, C, D) Volcano plots of differentially methylated regions upon DLD3 deletion for (B) H3K4me3, (C) H3K36me2, and (D) H3K36me3 in the BY4741 background. Each dot represents a called consensus peak and red dots represent differentially methylated regions (FDR < 0.05, absolute[log2FC] > 0.3). The numbers of significantly hypomethylated and hypermethylated genes in the dld3Δ strain are indicated in red and in green, respectively. (E) Visualised example of locus specific changes upon accumulation of 2-HG in the BY4741 background. For the HMX1 gene, we can see the formation of peaks for all the studied modifications in the dld3Δ compared with the WT strain. The changes in methylation are accompanied by increased gene expression (represented in TPM). For the AQR1 gene, we can see an increase in the H3K4me3 and H3K36me3 signal upon 2-HG accumulation, whereas no change is observed for the H3K36me2 modification. A change in gene expression is also observed. (F) Overlap between differentially methylated genes (DMGs) (FDR < 0.05, absolute[log2FC] > 0.3) for the analysed histone modifications. Venn analysis of DMGs shows weak coupling between methylation changes in different histone residues. (G) Overlap between the DMGs and the DEGs. For H3K4me3, only nine genes were overexpressed upon increase in H3K4me3 after 2-HG accumulation (dld3Δ strain). Similarly, for the H3K36me3 modification, the increase in methylation was accompanied by a significant increase in expression for only one gene.

