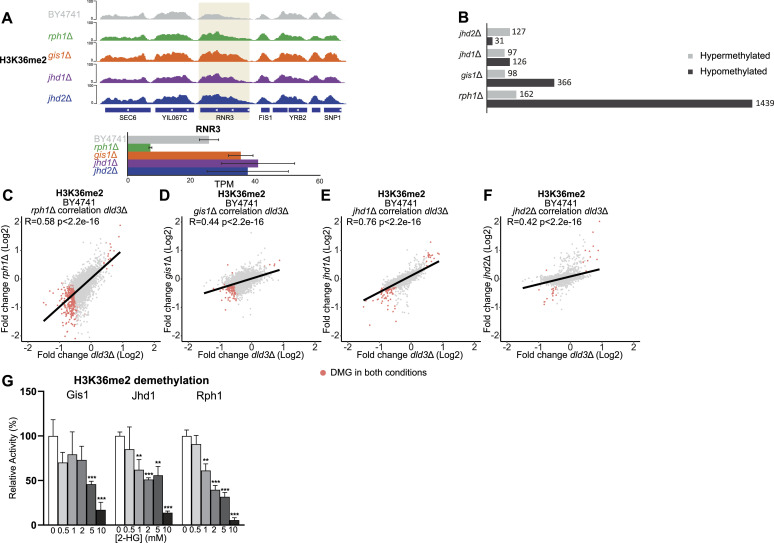
Figure 4. Locus-specific changes in H3K36me2 and inhibition of Gis1, Jhd1, and Rph1 by 2-HG.
(A) Locus-specific changes for H3K36me2 in the rph1Δ, gis1Δ, jhd1Δ, and jhd2Δ strains shown for the RNR3 gene. (B) Number of DMGs (FDR < 0.05, absolute[log2FC] > 0.3) with differential H3K36me2 in rph1Δ, gis1Δ, jhd1Δ, and jhd2Δ are shown as in Fig 3B. The greatest number of DMGs was observed for the rph1Δ strain. (C, D, E, F) Correlation analysis between differentially methylated genes in different histone demethylase deletion strains and the dld3Δ strain. (C, D, E, F) Log2-FCs of H3K36me2 in the dld3Δ strain are plotted on the x-axis, whereas log2-FCs in the (C) rph1Δ, (D) gis1Δ, (E) jhd1Δ, and (F) jhd2Δ strains are plotted on y-axis. Each dot represents a gene and red dots represent genes found to change significantly for H3K36me2 in both mutant strains (FDR < 0.05, absolute[log2FC] > 0.3). Pearson correlation is calculated for each set. The strongest correlation with the dld3Δ strain is observed for the rph1Δ and jhd1Δ strains. (G) Inhibition of the Gis1, Jhd1, and Rph1 enzymatic activities by 2-HG. A demethylation assay using recombinant enzymes and an H3K36me2 peptide as substrate was performed in vitro in the presence of increasing 2-HG concentrations. Enzymatic activities were determined based on initial velocities (in μM NADH.min−1) and normalized to the value obtained in the absence of 2-HG (set to 100%). Data shown are means ± SDs from three independent experiments. Statistical significance was calculated using t test; * = P < 0.05, ** = P < 0.01, *** = P < 0.001.

