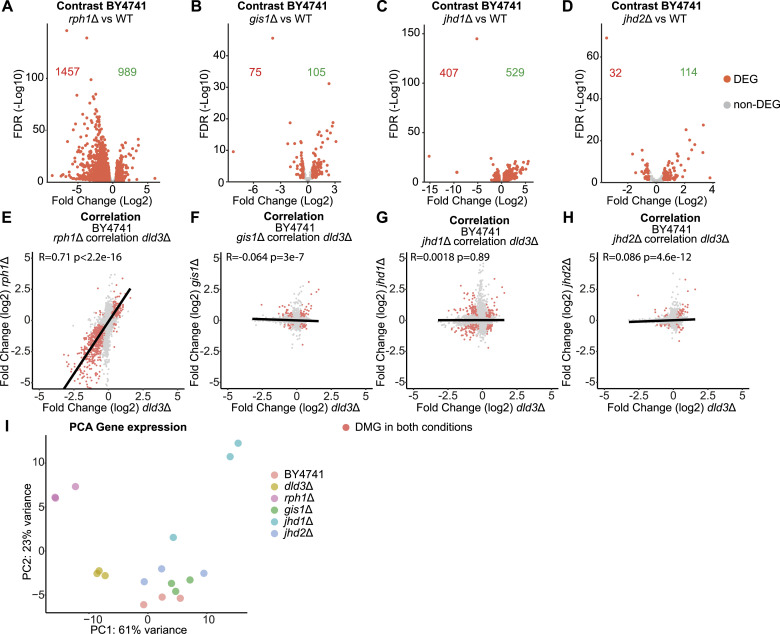
Figure 6. Transcriptomic analysis of demethylase deletion strains implicates Rph1 as the main mediator of 2-HG-induced gene expression changes.
(A, B, C, D) Volcano plots of differential gene expression upon deletion of (A) RPH1, (B) GIS1, (C) JHD1, and (D) JHD2. Each dot represents a gene and red dots represent DEGs (FDR < 0.05, absolute[log2FC] > 0.5). The number of down-regulated and up-regulated genes is indicated in red and in green, respectively. (E, F, G, H) Correlation analysis between DEGs in different histone demethylase deletion strains and the dld3Δ strain. (E, F, G, H) Gene expression log2FCs in the dld3Δ strain are plotted on the x-axis, whereas log2FCs in the (E) rph1Δ, (F) gis1Δ, (G) jhd1Δ, and (H) jhd2Δ mutant strains are plotted on the y-axis. Each dot represents a gene and red dots represent genes found to be significantly differentially expressed in both mutant strains (FDR < 0.05, absolute[log2FC] > 0.5). Pearson correlation is indicated for each comparison. The strongest correlation was observed between the rph1Δ and dld3Δ strains. (I) Principal component analysis reveals the transcriptomic similarity between the rph1Δ and dld3Δ strains. Three independent biological replicates of each strain are depicted in the indicated colours.

