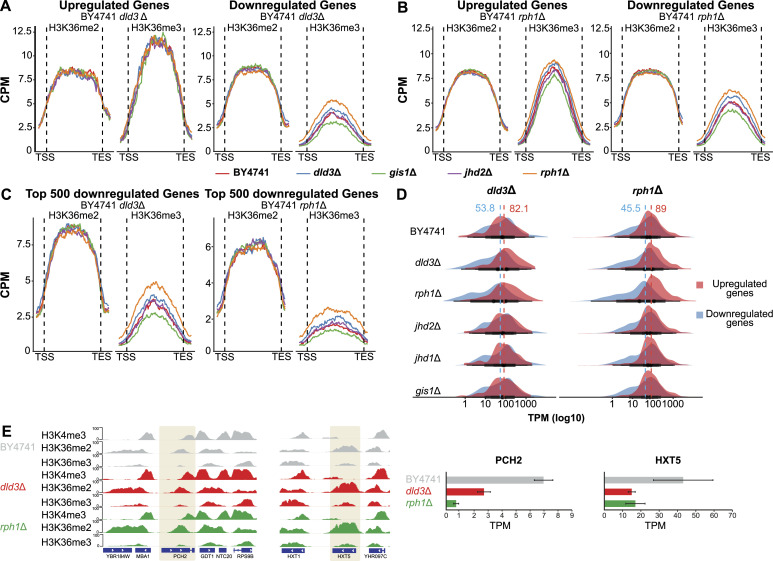
Figure 7. Rph1 inhibition by 2-HG leads to increased repression of silenced genes.
(A, B, C) Metagene plots depict the binned median signal for H3K36me2 and H3K36me3 from transcription start sites to transcription end sites of genes that are up- or down-regulated upon DLD3 (A) or RPH1 deletion (B) (FDR < 0.05, absolute[log2FC] > 0.5), or for the top 500 most down-regulated genes in the two BY4741 deletion strains (C). Red indicates the ChIP-seq signal in wildtype, blue in dld3Δ, green in gis1Δ, purple in jhd2Δ, and orange in rph1Δ. (D) Basal gene expression distribution (TPM values) of the genes up- or down-regulated (FDR < 0.05, absolute[log2FC] > 0.5) in the dld3Δ strain (on the left) or rph1Δ strain (on the right). Median expression of these genes across all analysed strains is indicated by the dashed lines, illustrating the low median expression of genes targeted for down-regulation already at baseline. (E) PCH2 represents an example of a gene down-regulated upon DLD3 and RPH1 deletion and shows no H3K4me3 methylation, high H3K36me2, and very low H3K36me3 levels (but that are modestly increased in the deletion strains). Similarly, HXT5 is also down-regulated in the rph1Δ and dld3Δ strains and associated with comparable chromatin states.

