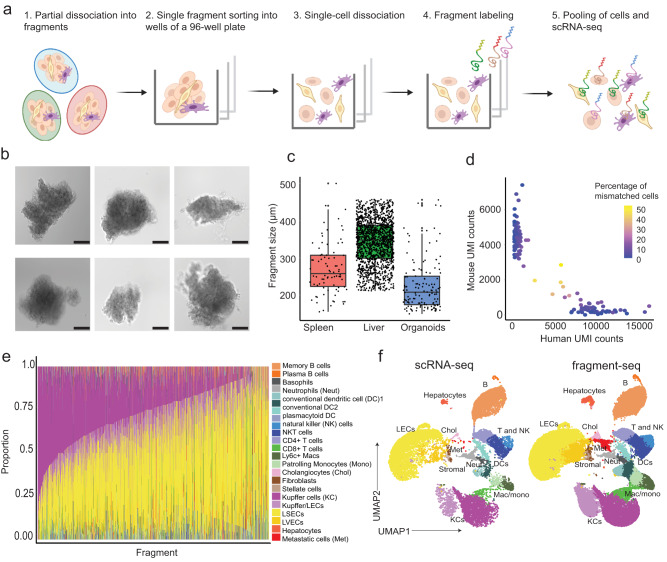
Fig. 1. Overview of fragment-seq and assessment of quality and accuracy.
a Schematic illustration of fragment-seq workflow. scRNA-seq: single-cell RNA-sequencing. Created with BioRender.com. b Brightfield microscopy images of representative liver fragments. Scale bar: 100 μm. Imaging was performed for 9 96-well plates in one experiment with results shown in Supplementary Fig. 1b, here six representative fragments are shown. c Fragment-size distribution of sorted fragments from different tissues visualized in boxplots [n = 82 (murine spleen), 1468 (murine liver), 138 (CRC organoid) fragments]. Black dots indicate fragments. For box and whiskers plots the middle line represents the median; the upper and lower lines are the first and third quartile (Q1 and Q3); the whiskers indicate the upper and lower limits of data spread by subtracting 1.5* interquartile range (IQR) from Q1 and adding 1.5* IQR to Q3. d Scatter plot showing the fraction of mismatched cells. Dots represent fragments and their color indicates the percentage of mismatched cells (human cells within mouse fragments and mouse cells within human fragments) (n = 139 fragments from 1 sample). UMI unique molecular identifier. e Barplot showing cell type proportions per fragment; only fragments with at least 5 cells are considered (n = 1568 fragments from a total of 10 samples). LEC liver endothelial cell, LSECs liver sinusoidal endothelial cells, LVECs lymphatic vascular endothelial cells. MAC macrophages f Uniform manifold approximation and projection (UMAP) visualization of batch-corrected (see the “Methods” section), single-cell transcriptomes from fragment-seq and scRNA-seq of mouse metastatic liver samples. Cells are clustered, annotated, and colored by their cell type. Cells are separated based on the protocol [conventional scRNA-seq (n = 2 samples) and fragment-seq (n = 10 samples)]. For c and d the source data are provided as a Source Data file.

