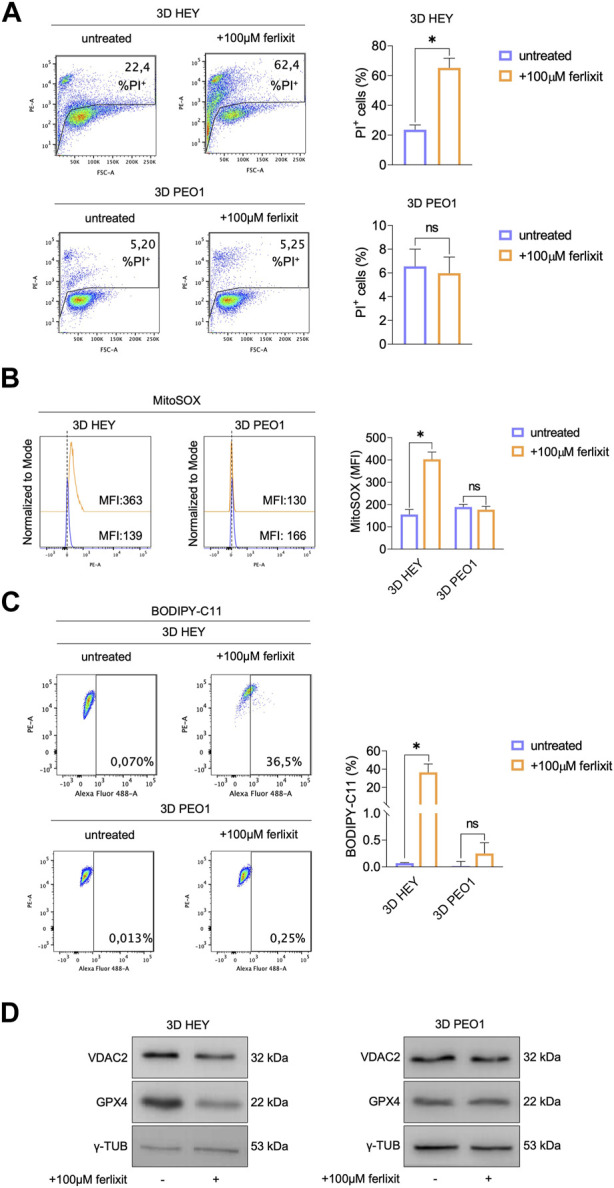
FIGURE 3.

Treatment with ferlixit leads to ferroptosis in 3D HEY tumor spheroids. (A) PI flow cytometric analysis of 3D HEY and PEO1 tumor spheroids untreated and treated with 100 μM ferlixit. % of dead cells (PI positive) are reported in each plot. Relative histogram is reported on the right. Flow cytometry analysis of mitochondrial ROS levels (B) and lipid peroxidation (C) quantified by using MitoSOX and BODIPY-C11 reagent, respectively, in 3D HEY and PEO1 tumor spheroids after administration of 100 μM ferlixit. Relative histograms are reported on the right. (D) Western blot of VDAC2 and GPX4 in 3D HEY and PEO1 cells upon administration of 100 μM ferlixit. γ-TUB was used as loading control. Results were obtained from three independent experiments.
