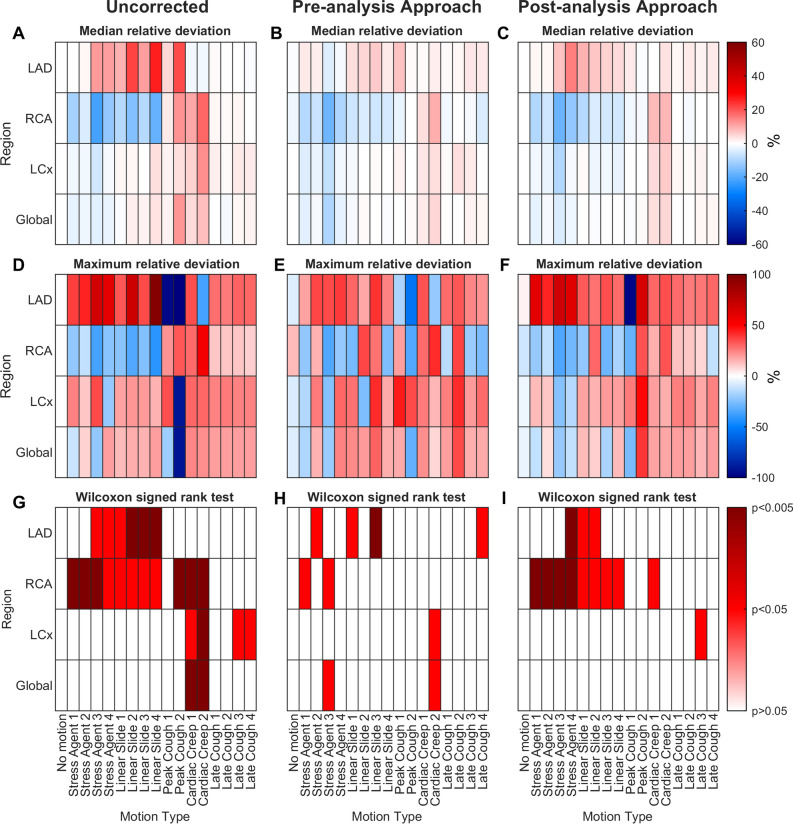
Figure 2.
Heat maps of uncorrected (A, D, G) and motion corrected images using the pre-analysis (B, E, H) and post-analysis (C, F, I) approach. The X-axis represents each type of motion. The Y-axis represents the coronary territories (LAD, RCA, LCx, and global). Median relative deviation (%) in MBF from the original motion-free images in uncorrected (A) and motion-corrected (B) images. Maximum relative deviation (%) in MBF from the original motion-free images in uncorrected (D) and in motion-corrected images using the preanalysis approach (E) and post-analysis approach (F). Results of the Wilcoxon signed-rank test, showing level of significance (P > .05, P < .05 or P < .005) in MBF deviation from the original motion-free images in uncorrected (G) and in motion-corrected images using the pre-analysis approach (H) and post-analysis approach (I). Every cell in A, B, C, G, H and I contains results from all 10 patients. Every cell in D, E and F contains results from the one patient with the highest maximum deviation

