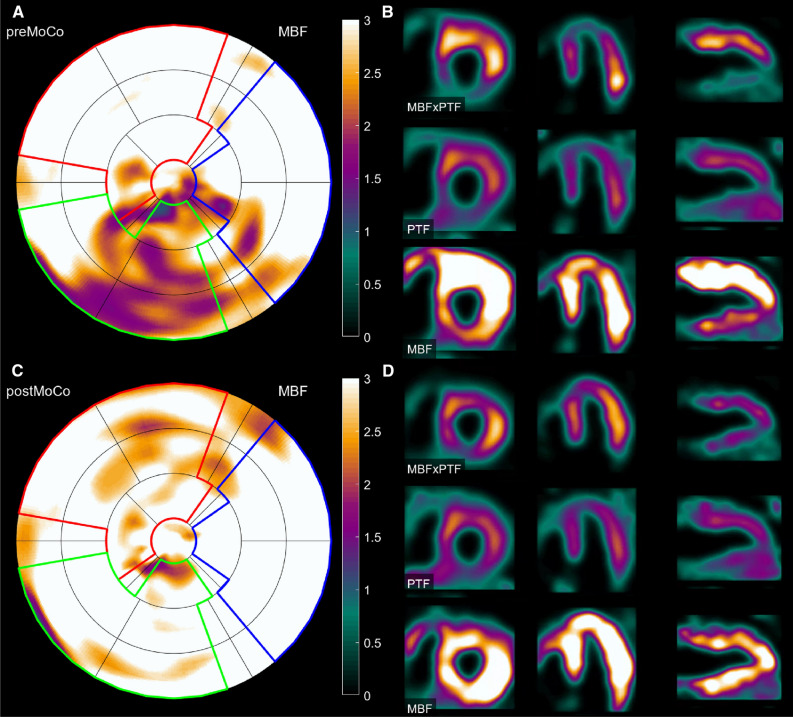
Figure 5.
PET images representing a patient from the clinical cohort pre- (A, B) and post-motion (C, D) correction. In the polar plot in A, a motion artifact has caused a false positive defect (20.1 %) in the RCA territory. In the post-motion correction polar plot in C, the motion artifact is completely reduced (defect 0.0 %). Splash images of short axis, horizontal long axis, and vertical long axis in B demonstrate the effect of motion artifacts on the visual interpretation of the images. The inferior wall appears hypoperfused compared to the rest of the myocardium. The post-motion correction splash images in D, demonstrate a uniform tracer uptake, thereby eliminating any suspicions of defects in the inferior wall. MBF, myocardial blood flow (mL⋅min−1⋅g−1); PTF, perfusable tissue fraction (mL⋅mL−1)

